When connecting your dataset into Tableau, it separates fields that are the date data types into hierarchies so you can easily break down your dashboard. You can also create custom hierarchies for your own convenience, for example - if you have a set of field named State, City, Zip Code, you can create a hierarchy from these field names to quickly narrow down your data in the dashboard.
The hierarchy icon is denoted with a plus sign or a minus sign inside a box as such:

The plus sign suggests that you can drill down further as there are more levels in the hierarchy whereas the minus sign would help you to track back to one level higher in the hierarchy.
Creating your own hierarchy:
- In the Data pane, drag a field and drop it directly on top of another field.
- When prompted, enter a name for the hierarchy and click OK.
- Drag additional fields into the hierarchy as needed. You can also re-order fields in the hierarchy by dragging them to a new position.
Have a look at the following video to see how to create your own custom hierarchy!
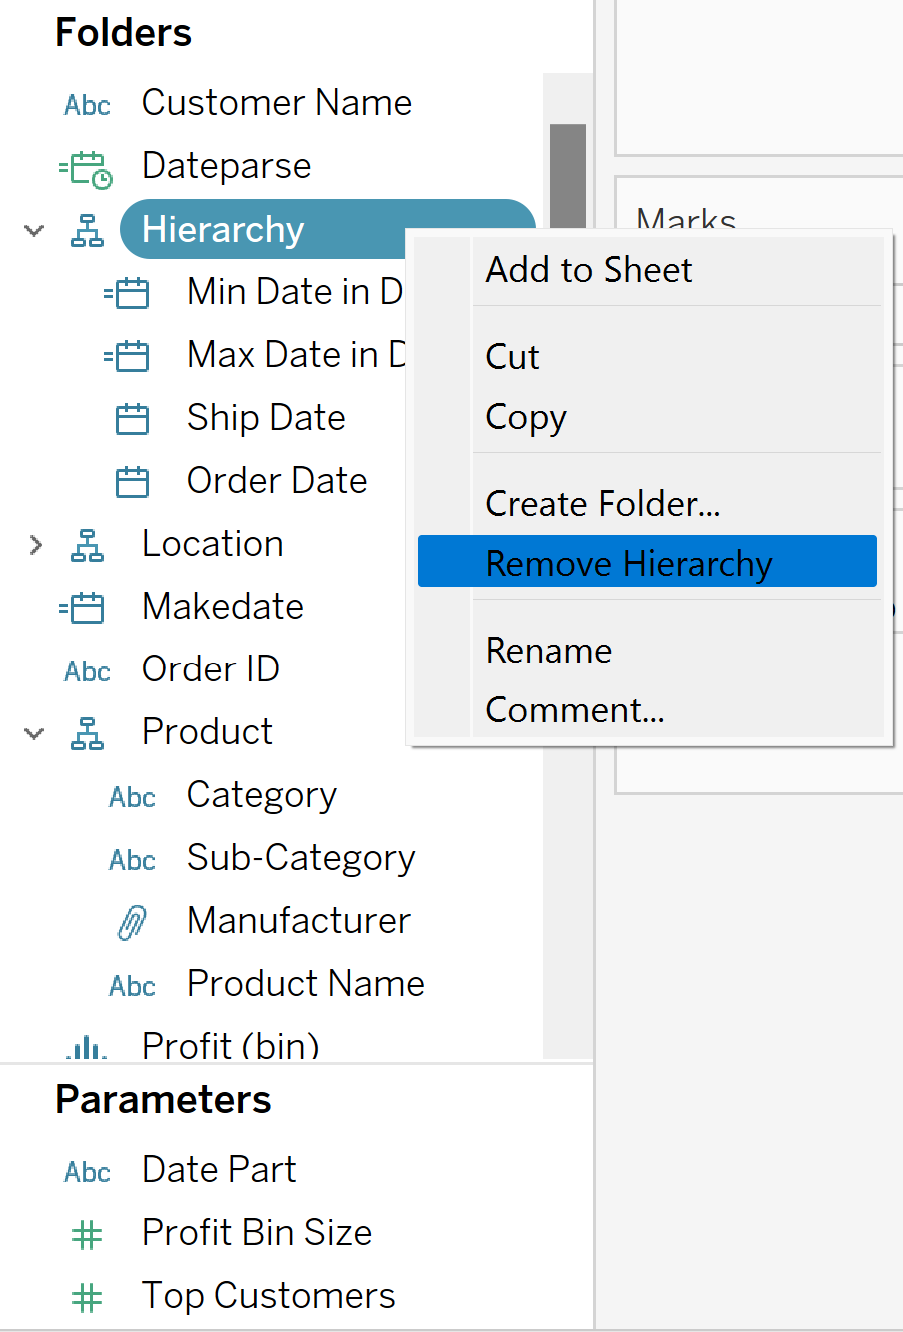
Remove a custom hierarchy:
Right-click the hierarchy folder that you created and press remove hierarchy. All done!