


In layman terms, a data cube refers to a multi-dimensional data structure - so, data within a data cube is shown by specific dimensional values.
It doesn't always live in 3 dimensions even though it is called a 'cube' - it can be 2-dimensional in the form of a rectangle, or 3D or even 4D (which is a little hard to visualize).
As a concept, it is a little hard to comprehend without being able to visualize it, and visualize it through a use case or an example so lets dive right in.
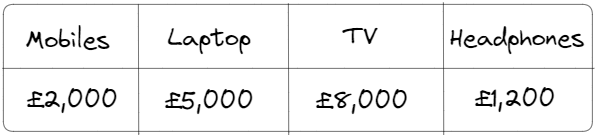
Lets take a company that sells technology, they sell 4 items - mobiles, TVs, laptops and headphones. Below we have 2022 data of the sales made in a one-dimensional array;
The company, however, are selling these products accross four cities in the UK - London, Manchester, Leicester, Birmingham. So we need to split this table further by products and cities resulting in;
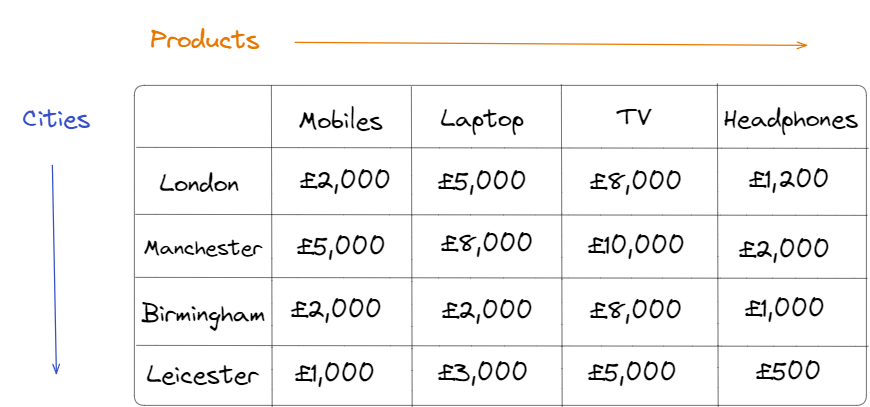
Now we can calculate the sum across each column for products and each row for cities. Great. We can add another column and/or row with 'ALL' for their totals.
But... what if we wanted to split this revenue by date? It would be easiest to have 4 tables for each quarter or 12 tables for each month. Simple. However, this is where data cubes come into polay. We can create a third dimension called 'Date' by stacking all 4 tables together:
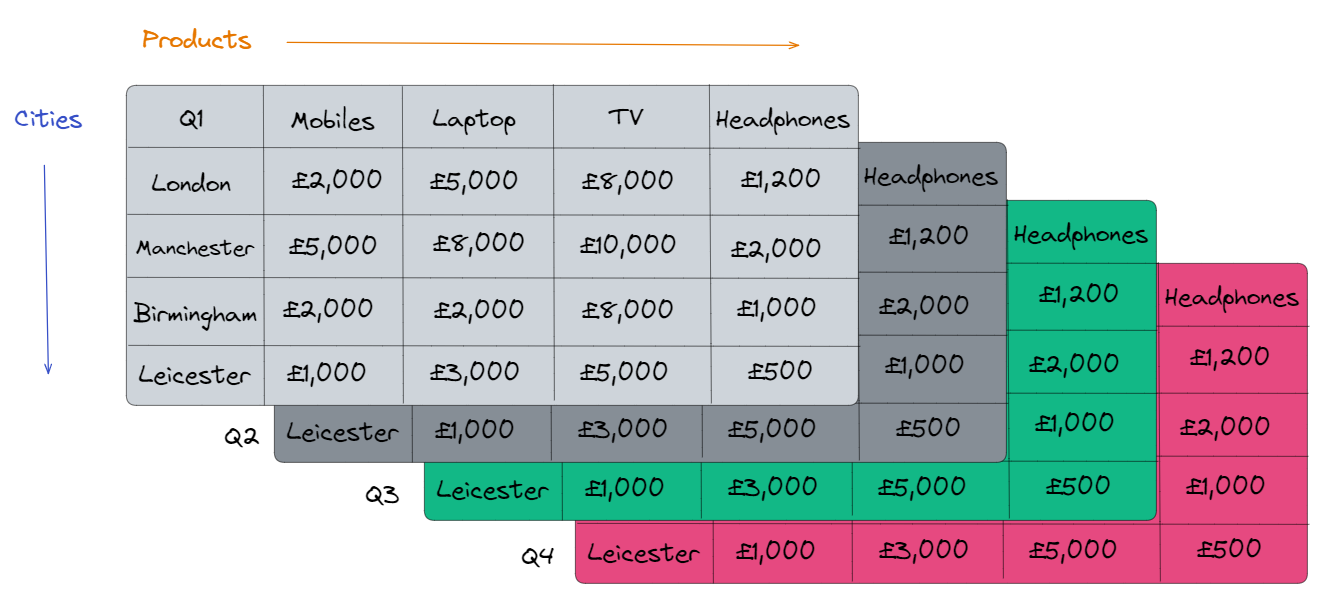
There is now one more dimension we can sum over. As an example, we'll calculate the sales for a full year of mobile purchases in Leicester:
£1,000 + £1,000 + £1,000 + £1,000 = £4,000
Similar to the 'ALL' we would've created for Products and Cities, we can do this for Date as well. In this way, all 3 data cube dimensions will meet in a single data cell, storing the total sales for a full year.