Cleaning the data
First, pick a dataset set from one of the numerous choices on the NHS website: https://www.nhsbsa.nhs.uk/prescription-data
BE WARNED!
These datasets have millions of rows, so, I would suggest only picking one month of data and working on that.
For that very reason, I have chosen Nov 2020.
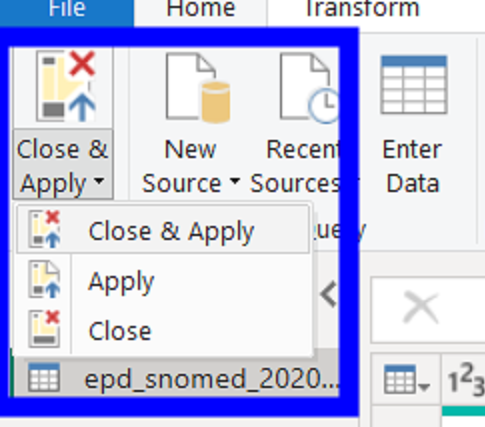
Now load the data onto the cleaning software of your choice. I will be working with Power Query.
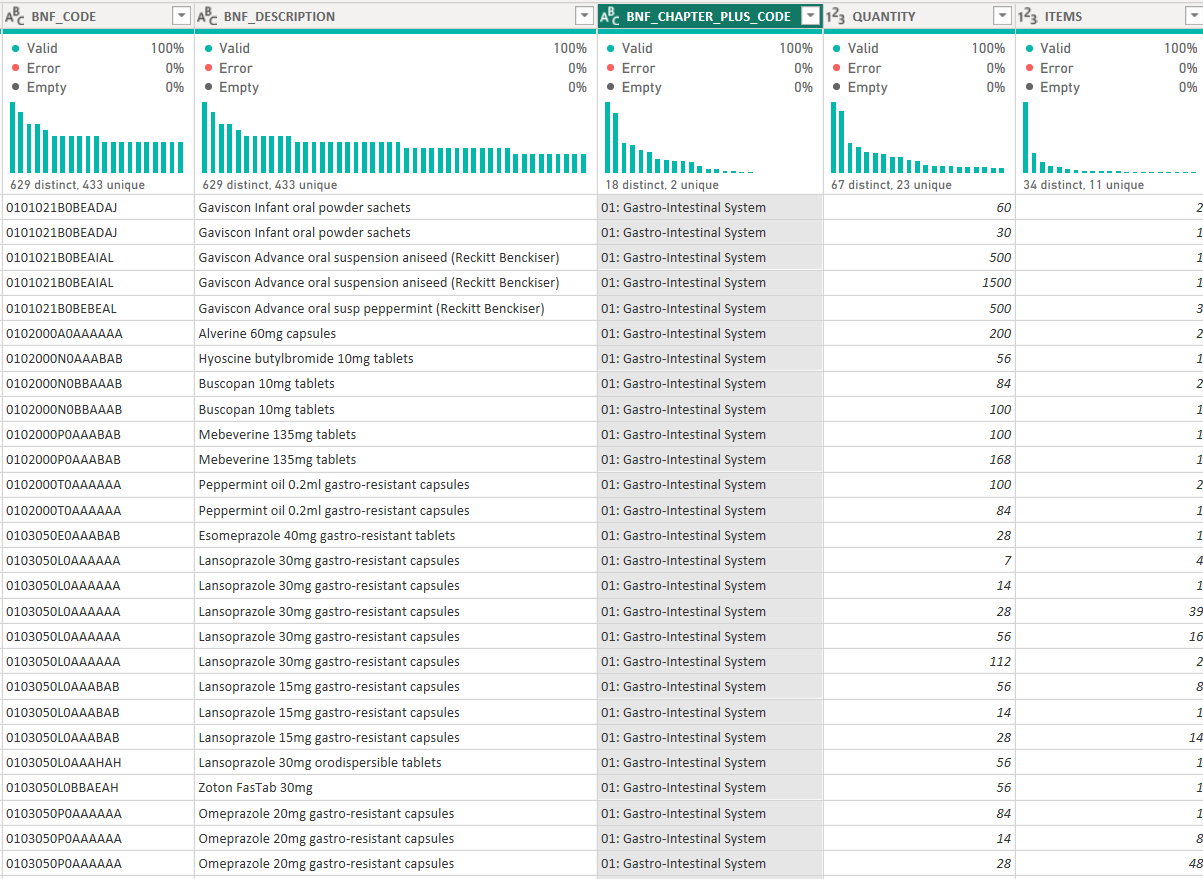
Here is a snippet of what the data looks like:
If you look closely you will notice something wrong immediately.
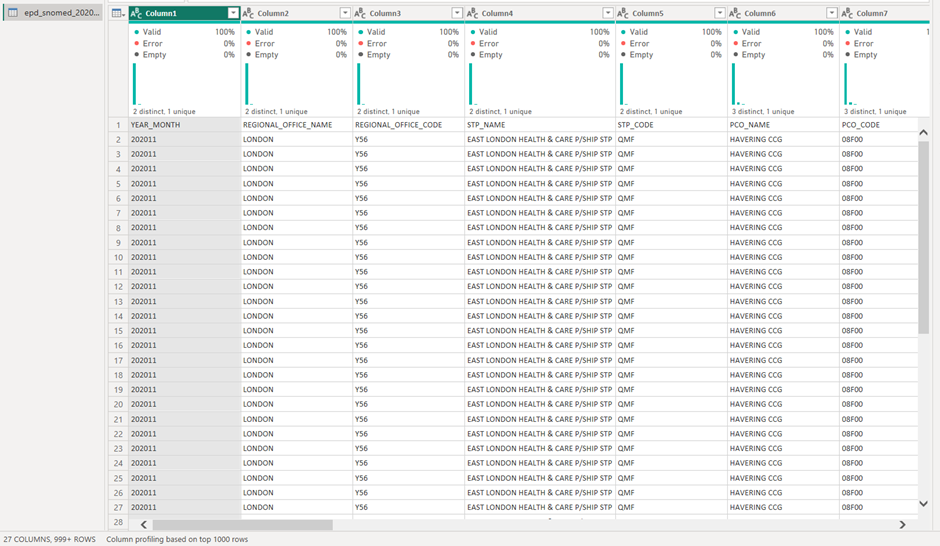
The field names were not placed as headers automatically.
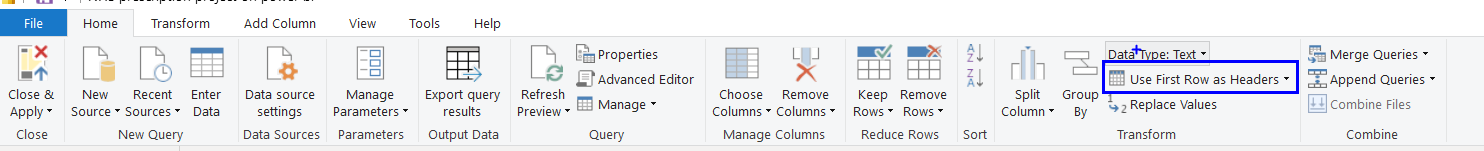
Fixing this is super easy, just click the option on the home pane that says "use first row as headers".
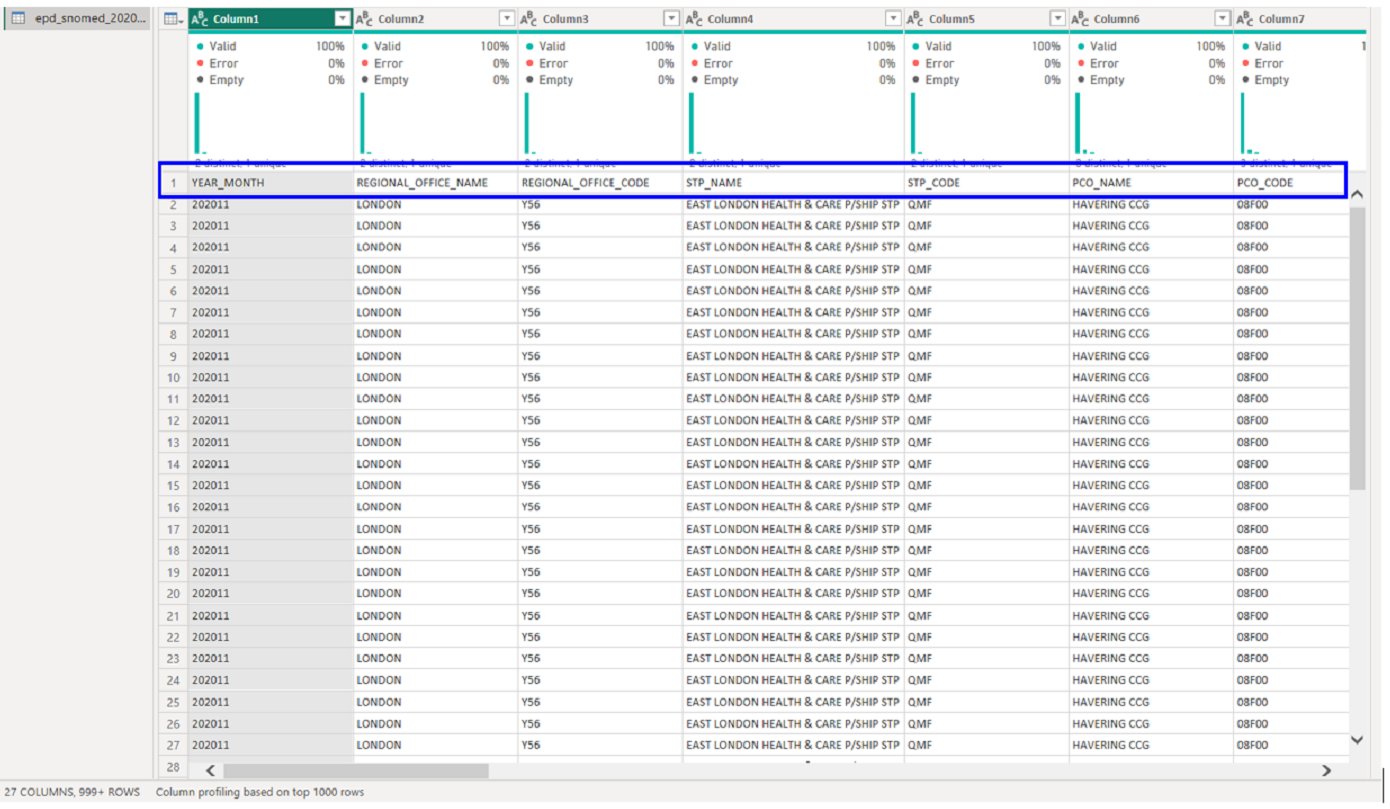
This should be your outcome:
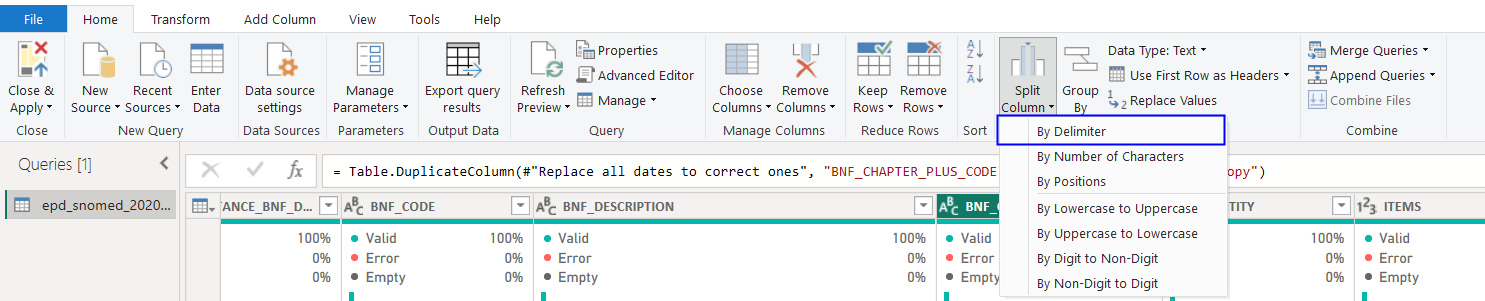
Next: splitting up the number and text of the highlighted column in the image above.
Firstly, highlight the column. Then select "Split Column" in the home page and then "By Delimiter".
As you can see, the text and number are separated by a ":" which is a delimiter.
A pop up box like this will appear:
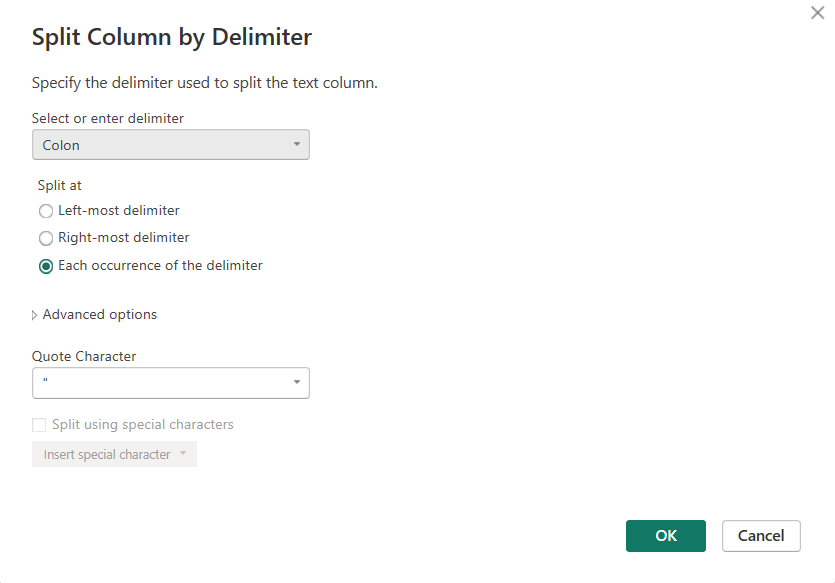
Since there is only 1 delimiter, and, we want to obtain the values on both the left and right side of it, we would use the "Each occurrence of the delimiter".
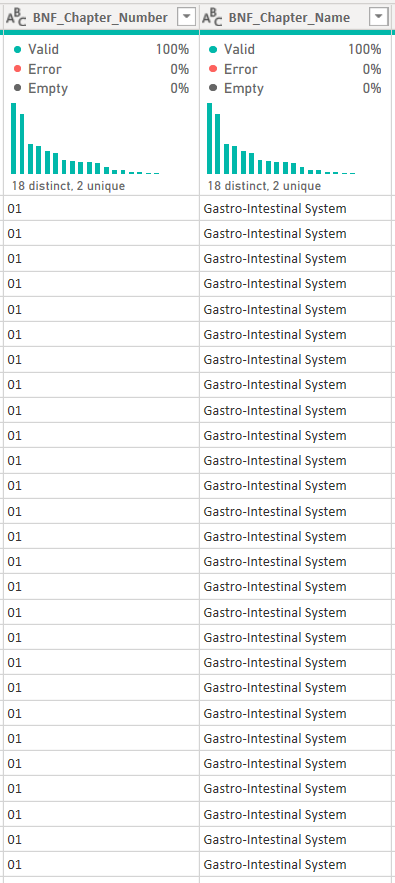
Now you have split that 1 column into 2.
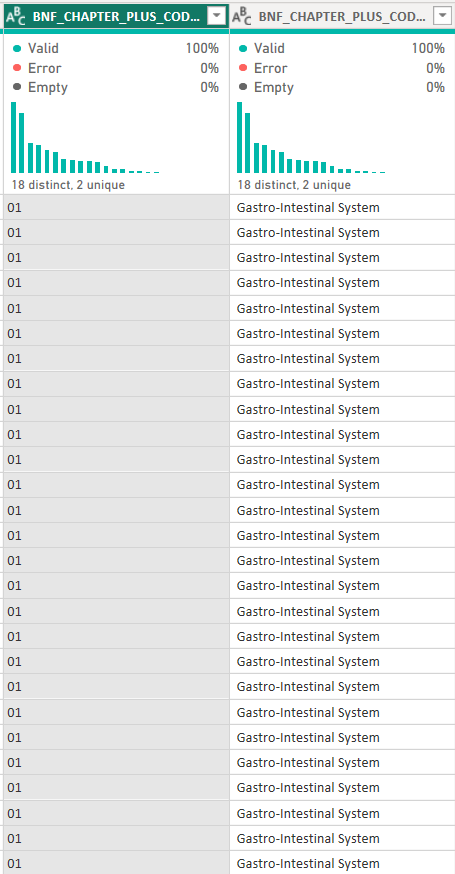
Rename these columns for documentation purposes.
Now hit apply and close on the home pane, and we are ready to move onto Power BI.