So the ultimate day of the data school and our last day of dashboard week has finally come. Todays task was building a dashboard about the tv show survivor.
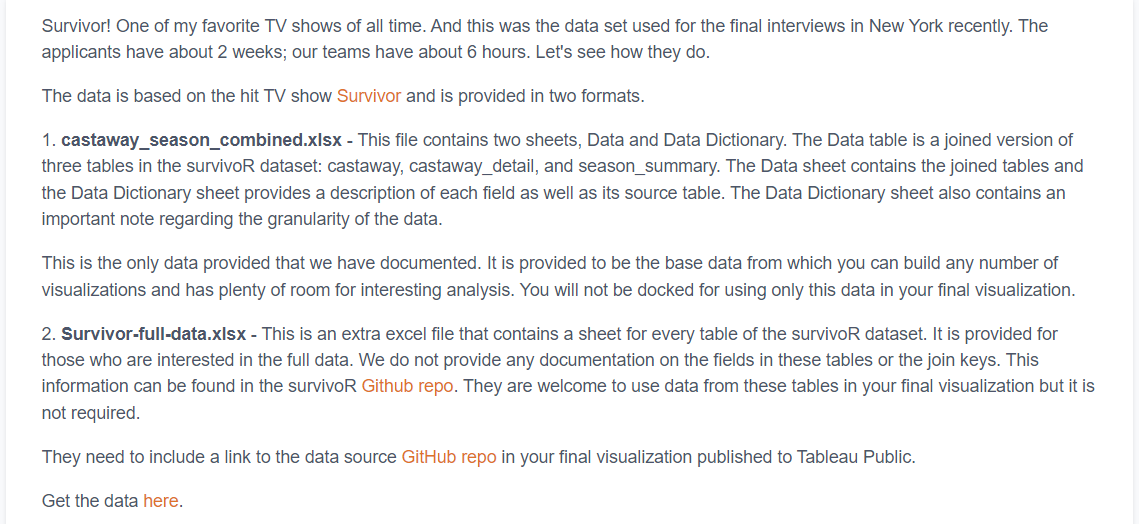
Here's the brief below:
Truth be told I've never been a fan of tv show data as there's usually a lot of data in string form and less measures to play with.
It also doesn't help that it was quite a large data set to understand especially for someone who's never seen the show.
I spent a lot of the day trying to create graphs which were very complex but then had to quickly produce a dashboard which had something I could present, abandoning my previous plan.
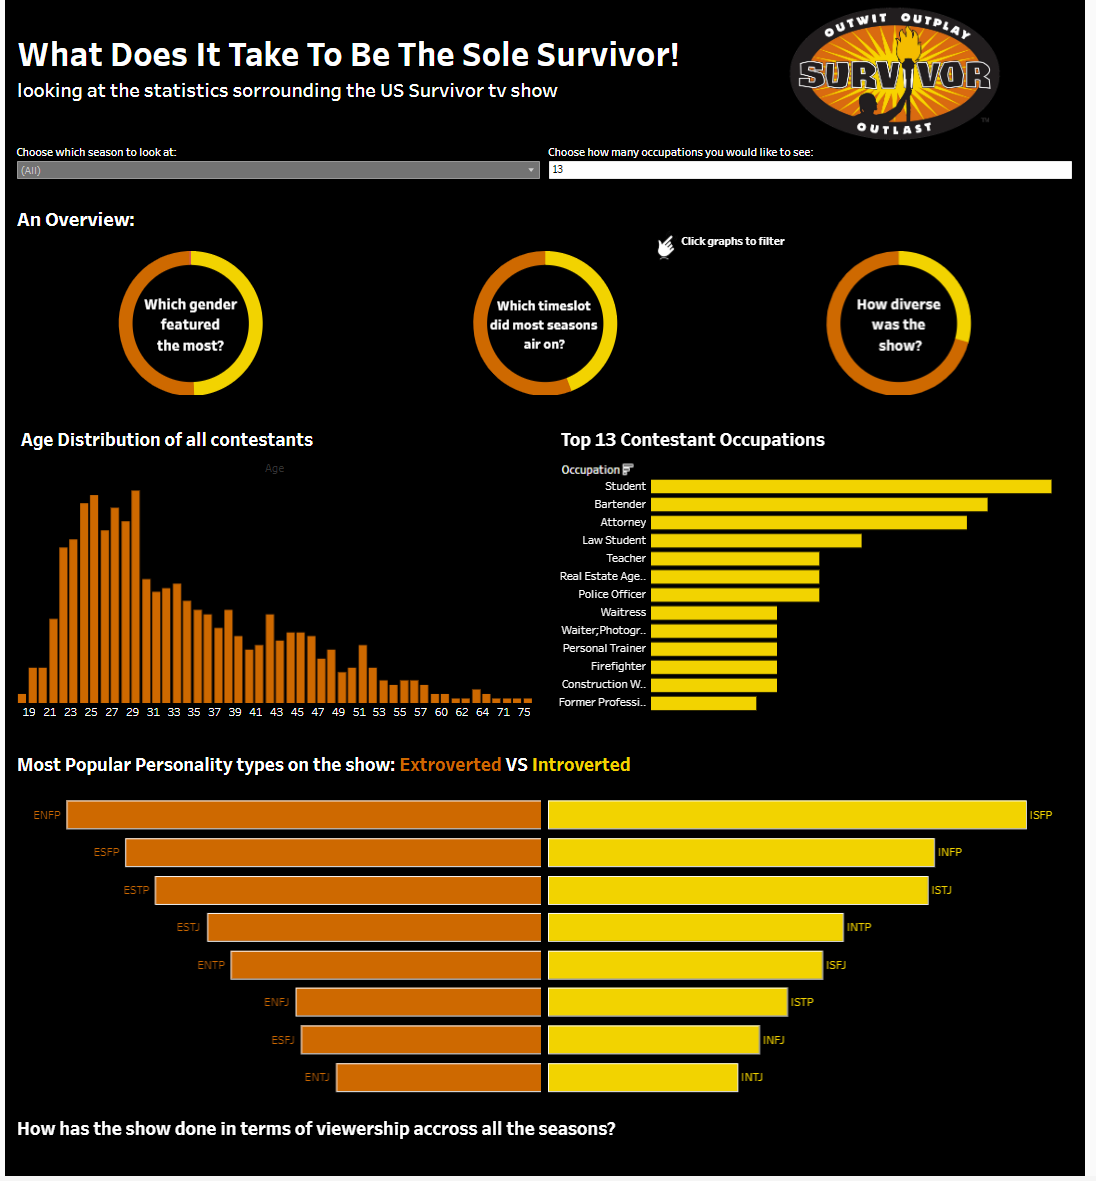
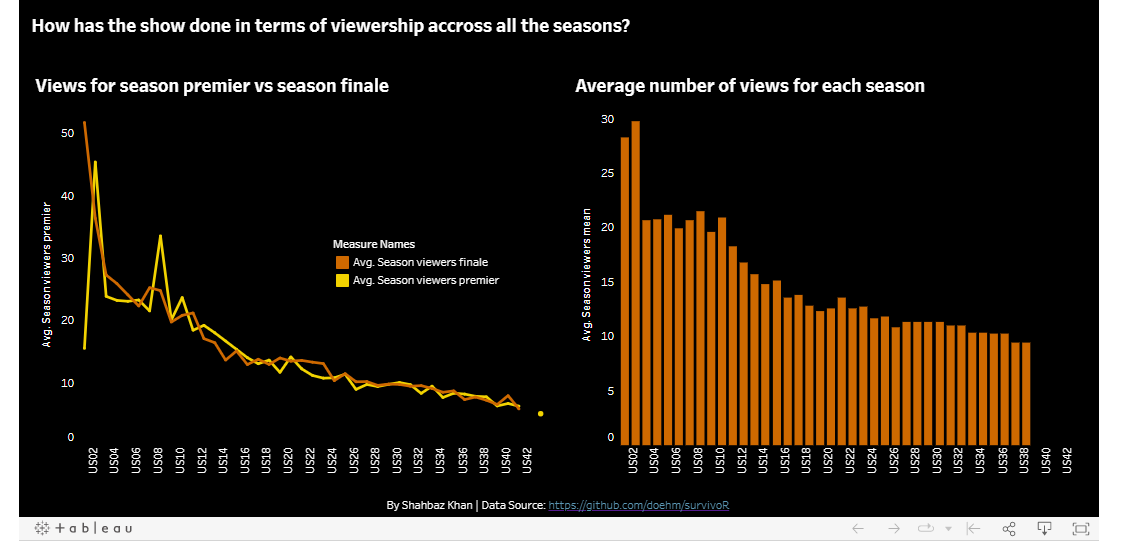
Here's what I ended up with: