


This week I want to write about the 'Order of Operations' in Tableau...
First things first...
Step 0: The Structure
Before you even see a sheet, you have to tell Tableau how the data fields even talk to each other. Joins and Relationships come into the story. In Tableau, how you connect your tables determines what data is allowed to exist in your analysis.
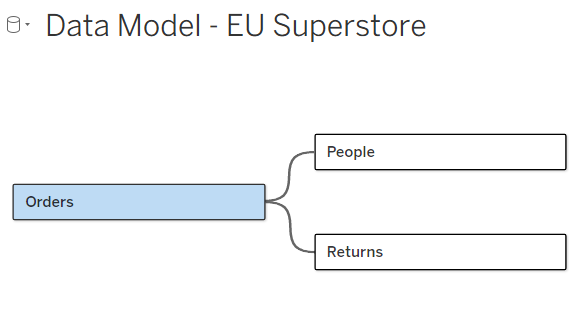
In the example here, the tables 'Order', 'People', and 'Returns' are loaded to Tableau. After that People has been related on the table column 'Region' and 'Returns' on the columns 'OrderID'.
... Tableau doesn't perform every action at once. It's literally an assembly line. If one part is not added in the right order, the machine will not function the way it is supposed to work.
In Tableau this means that data will not be shown the way it should be seen.
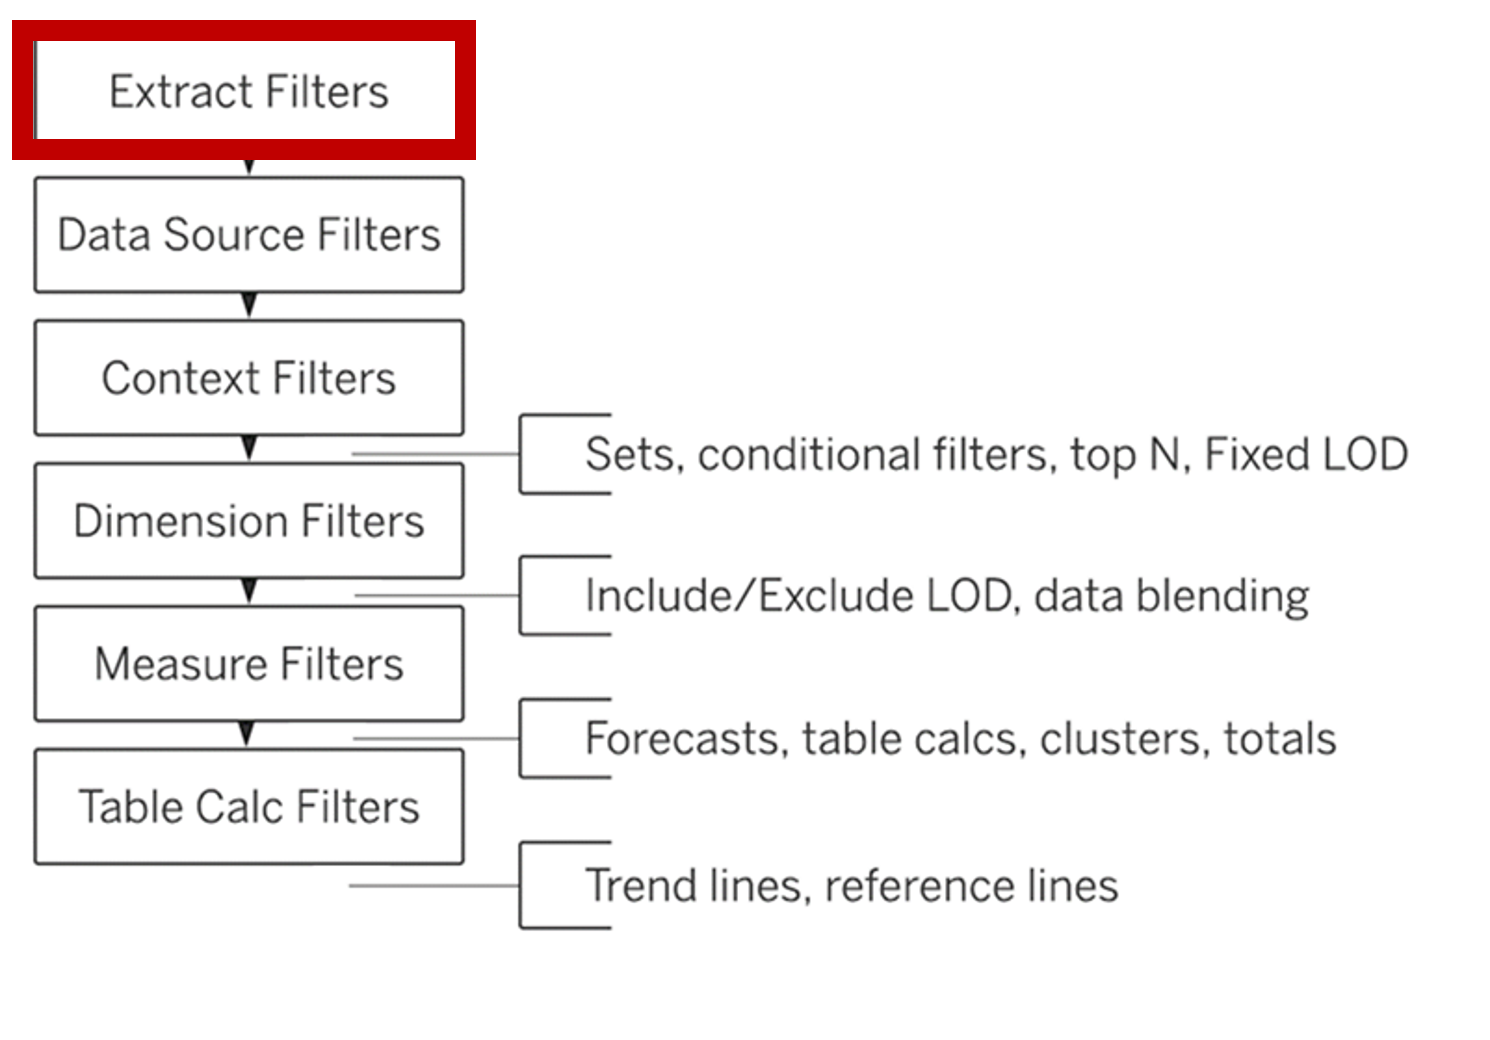
Extract Filters
The Explanation
When you create an extract (.hyper file), you are taking a snapshot of your data. An extract filter tells Tableau to only take a specific slice of that snapshot. Because this happens at the 'physical level, any data you filter out here is deleted completely.
Superstore Scenario
You have the full EU Superstore data (all of Europe, years 2023 - 2026). However, you are builing a dashboard for the DACH Region (Germany, Austria, Switzerland) for one year specific year onlay.
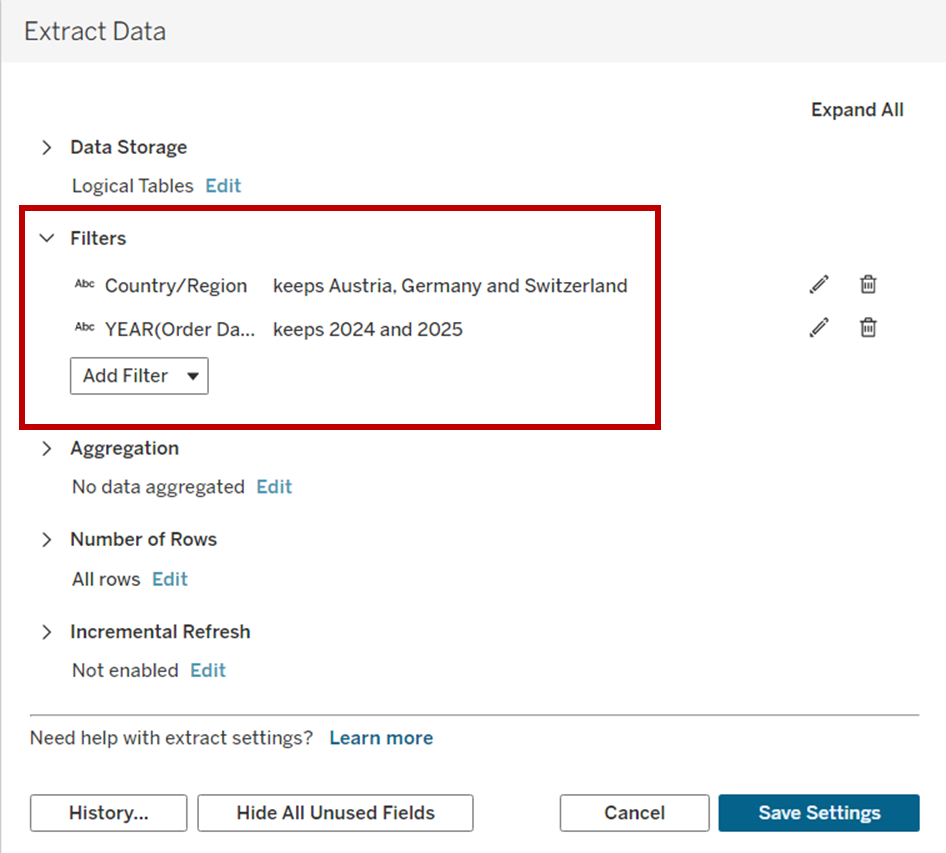
What you actually do:
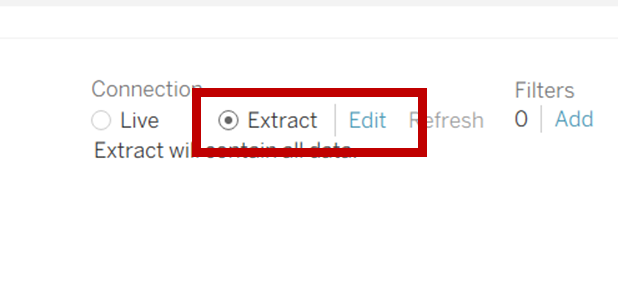
- On the Data Source tab, select Extract.
- Click edit (next to the Filters button in the top right).
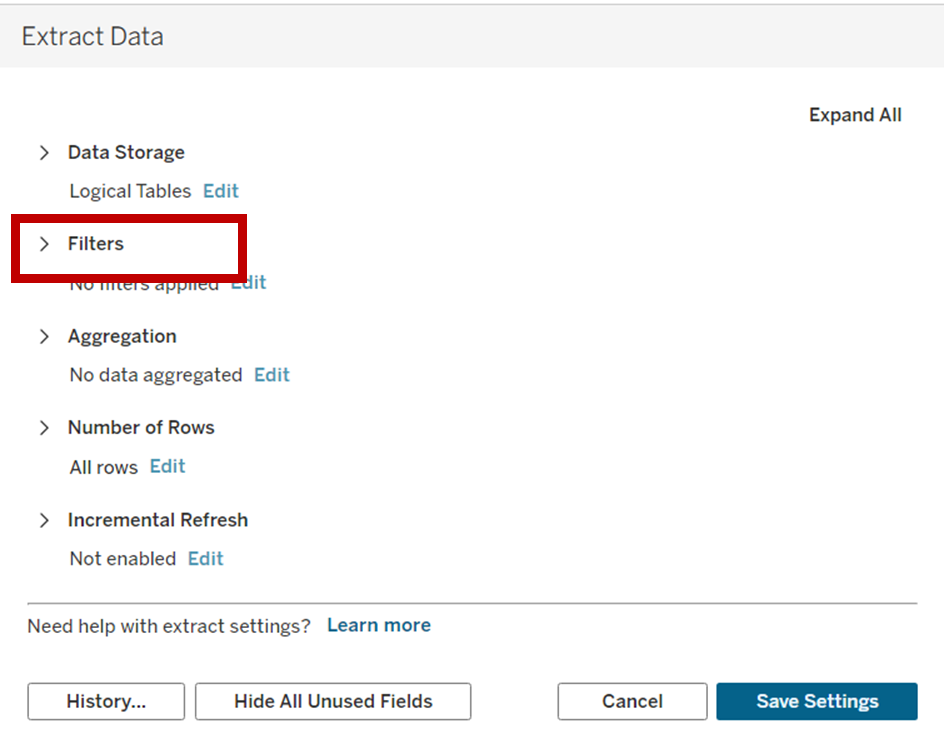
- Add a filter for [Country] Germany, Austria, and Switzerland.
- Add a filter for [Order Date] and select 2024-2025.
The Pro
Speed: Tableau is not scanning 4 years of data for 20 countries. It is only taking a tiny snapshot, containing exactly what you need.
The Con
If you are in a worksheet and suddenly decide you want to see France as well, you won't find it, since France was never packed into the extract. The Extract Filter must be adjusted accordingly.
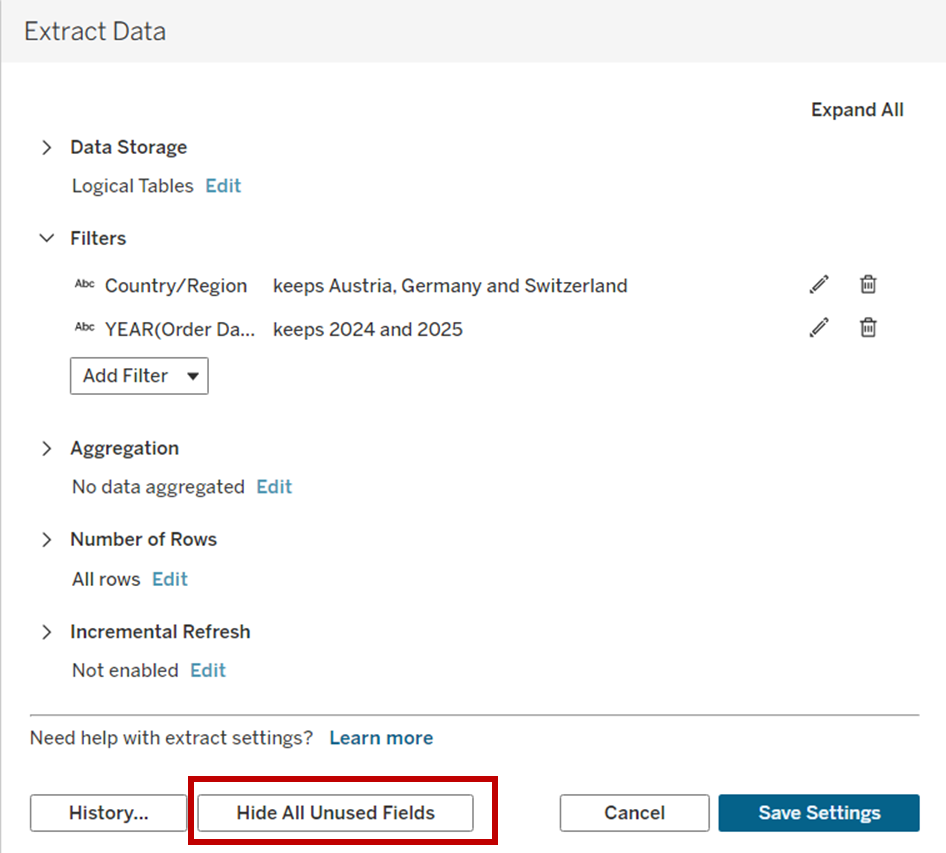
The Extras
In the same Extract menu, there is a button to 'Hide all Unused Fields'. It's like an Extract Filter for columns. It filters any dimensions or measures you are not using, making the file even smaller and faster.
Data Source Filter
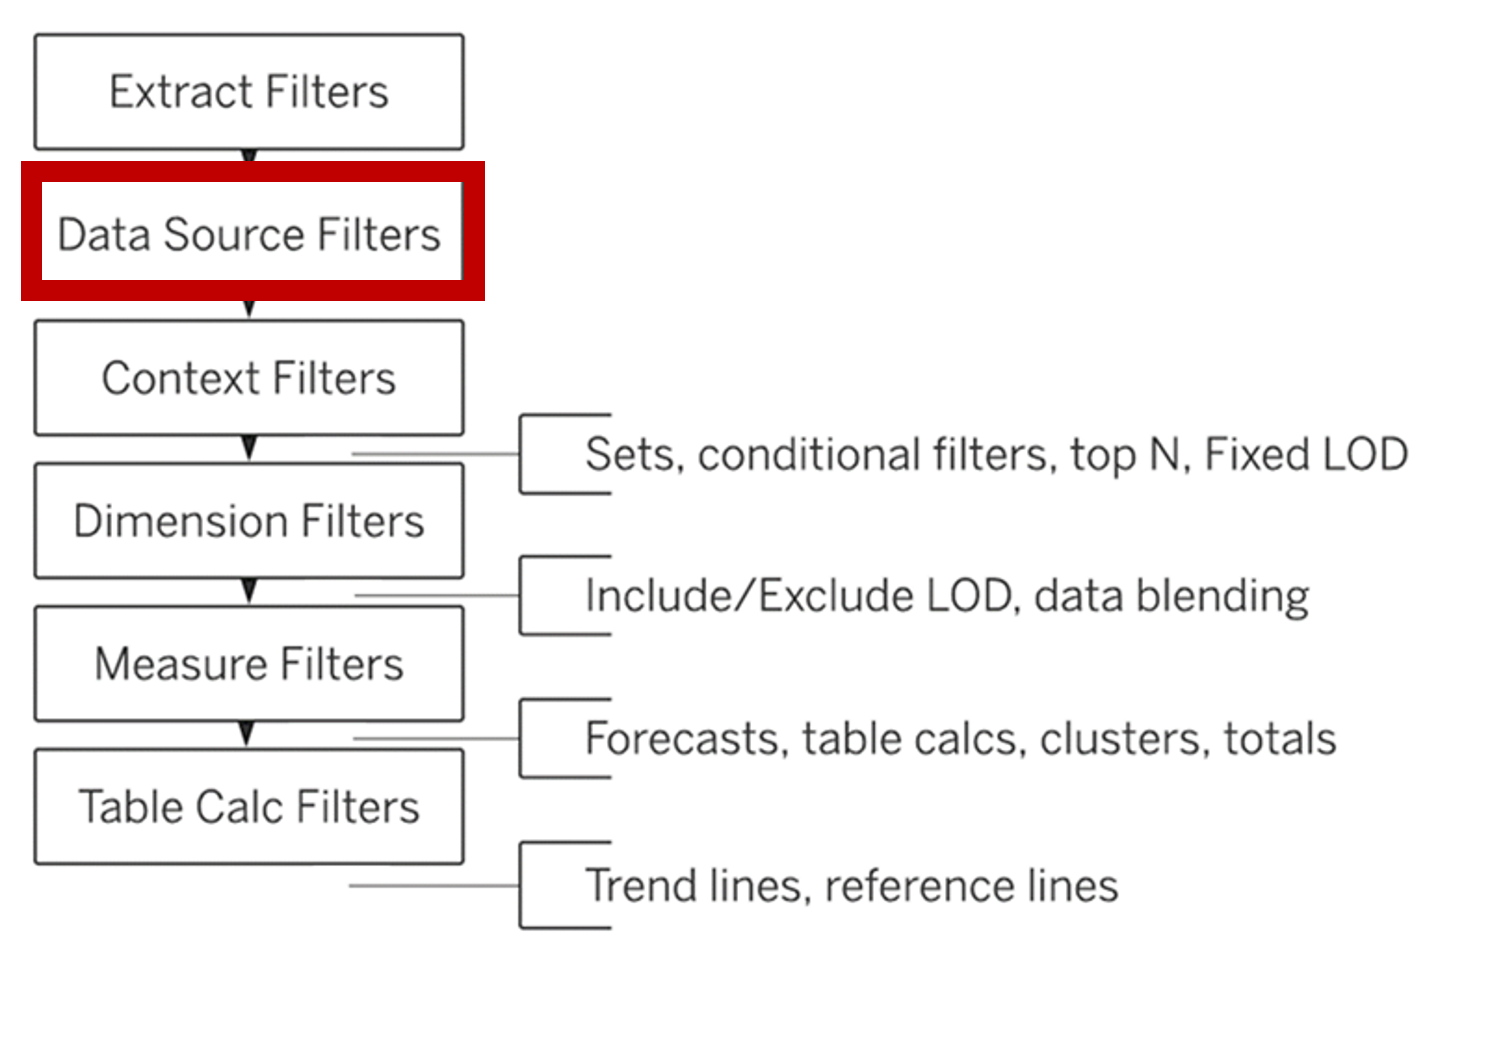
The Explanation
The Data Source Filter is the connection of data to the workbooks. Even if you decide not to use the Extract Filter, the Data Source Filter sits at the top of the workbook level. It dictates what data is flown into the worksheets.
Superstore Scenario
In this scenario we are using the EU Superstore database. In this case we are only using the Office Supplies and we don't want other users to even see the other options in their filter sidebars.
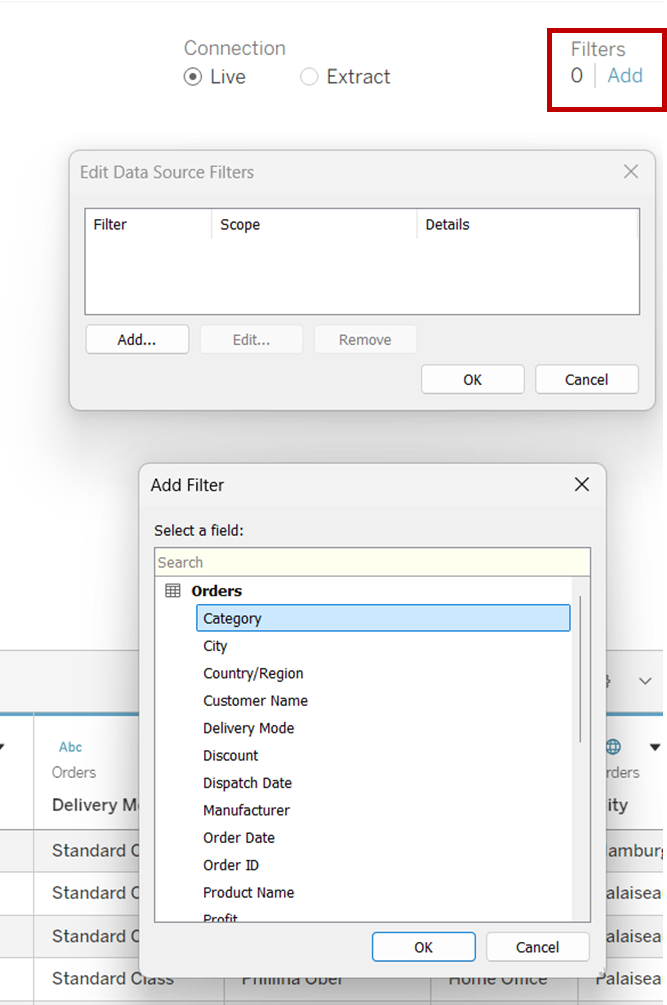
What you actually do:
- Go to the Data Source tab in the bottom left.
- In the top right corner, under 'Filters', click Add.
- Select the field [Category]
- Check only Office Supplies and click OK.
The Pro
You don't have to manually add a 'category' filter to every single sheet you create. It's applied to every worksheet automatically.
The Con
Inflexibility: Because this happens before the data even reaches the worksheet, you cannot unfilter afterwards. If you want to see for example Technology again, you need to go the Data Source again.
Context Filters
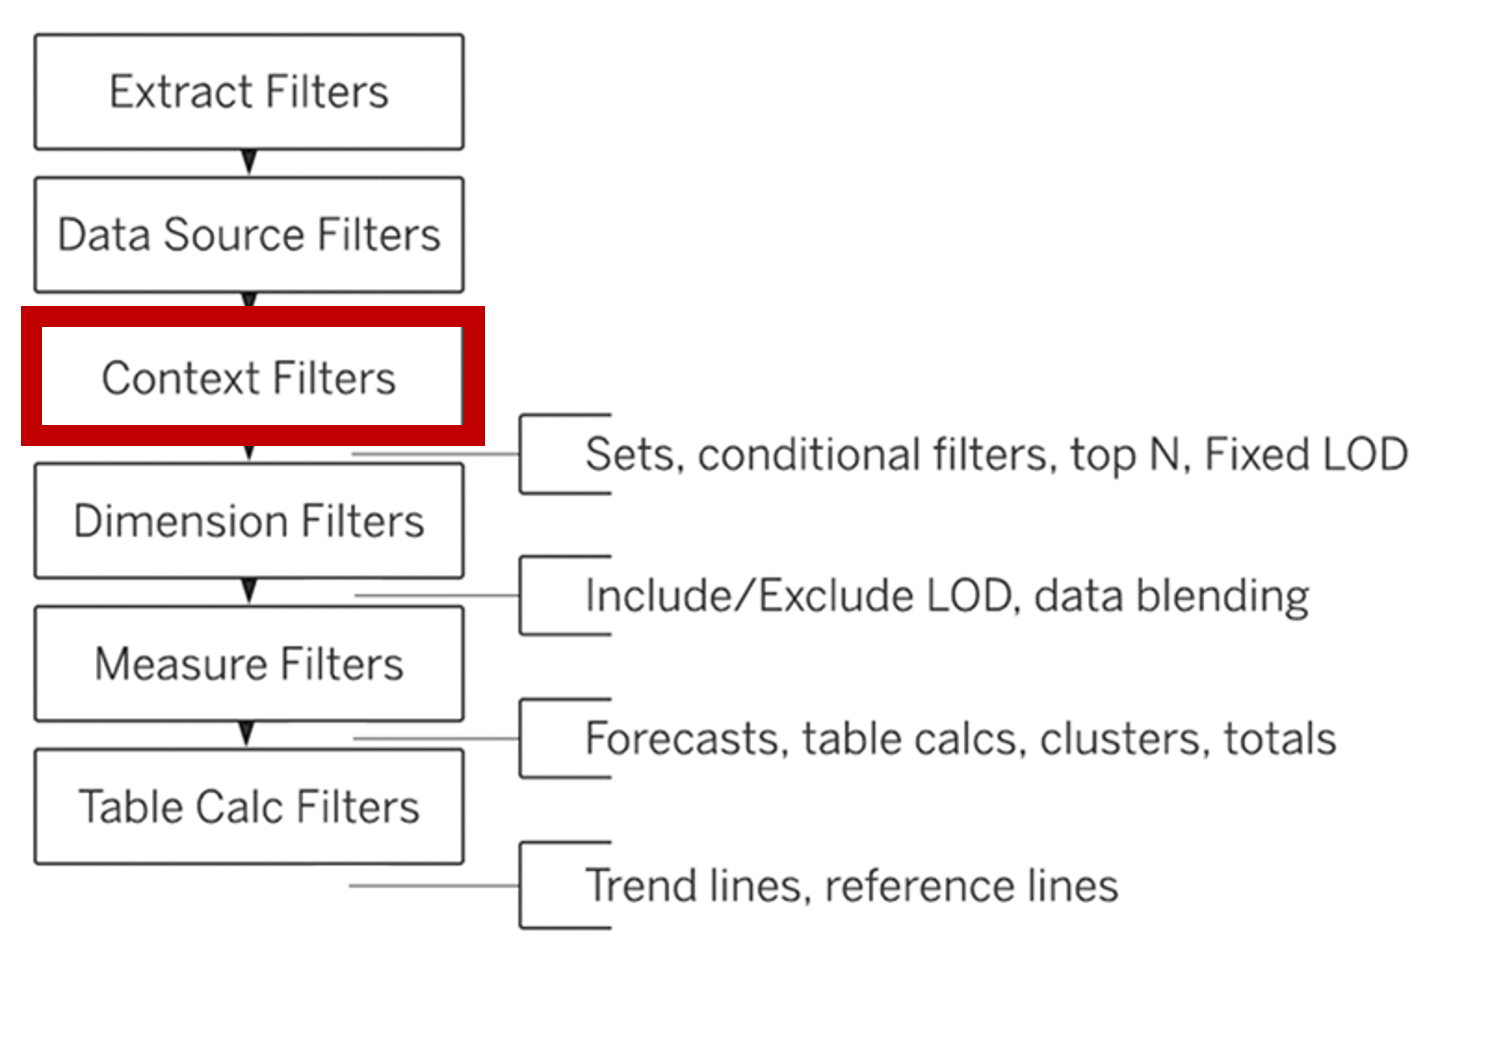
The Explanation
A Context Filter is an elevated filter. By 'Adding to Context', you are telling Tableau to process this filter before it calculated anything else on the sheet. It creates a temporary subset of data that the rest of the visual must include.
Superstore Scenario
You want to show the Top 10 Customers by Sales, but you have filter on Region. If you use a normal filter for 'Central', Tableau finds the Top 10 customers in the entire world first, and then does for the indicated filter here 'West'. In that case Tableau filters for the Top 10 first and goes for the ones in the West. If only two are in the global Top 10, then the chart will only show two bars.
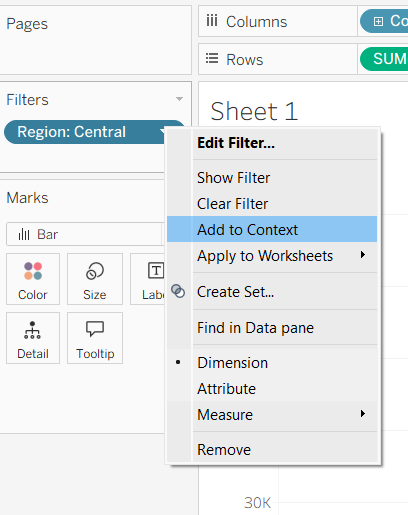
What you actually do:
- Drag [Region] to Filters Shelf.
- Right-click the pill and select 'Add to Context'
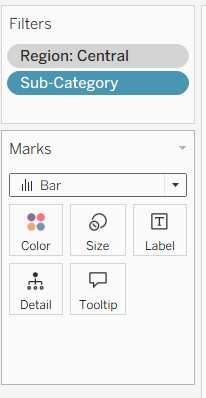
- The pill will turn grey, signaling it has been ordered in the Order of Operations.
- Tableau will filter for 'Central' first, and then finds the Top 10 customers within that specific region.
The Pros
It is the only way to make Fixed LODs react to a filter on the wokrsheets and dashboards. On a large dataset it can improve speed. Further, it ensures that the lists you created actually reflect the other filters applied.
Dimension Filters
The Explanation
A Dimension Filter is the standard filter in Tableau. You drag categorical field into the Filters shelf and... tada, depending on which category Tableau will filter based on that.
Superstore Scenario
You have a dashboard showing total sales across all years, but you only want to see the data for specific 'Sub-Categories' that you want to reflect onto. When you apply this filter, Tableau looks at the data passed through 'Context Filter' (mentioned above).
What you actually do:
- Drag the [Sub-Category] dimension to the Filters shelf.
- A dialog box appears; select 'Appliances, Binders, Labels and Supplies' and click OK.
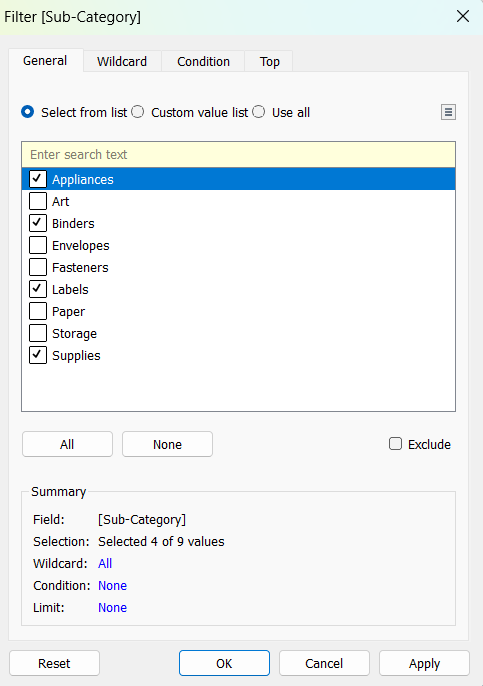
- The pill on the Filter shelf remains blue (discrete) and green (continuous), signaling it is a standard filter.
The Pros
It is intuitive. It is the most interface-friendly filter. You just drag and drop. Further, it is interactive as these are filters most commonly shown to end-users and therefore making dashboards easy to navigate.
The Cons
As mentioned above the Fixed LOD filter will not be changed by this filter. You might have to go back to Context Filter and take out the LOD in order for this filter to show the correct value.
Performance might slow down if you have a number of certain Dimension filters on a single sheet, because Tableau has to evalute each one against every row in the data, which can ultimately slow down your dashboard.
Measure Filter
The Explanation
Measure Filter happen after Tableau has aggregated the data. While the Dimension Filter looks at the individual rows, A measure Filter looks at the total result such as 'is the Total Profit for this category > $5,000. Of course it is also depending on the Level of Detail in the view.
Superstore Scenario
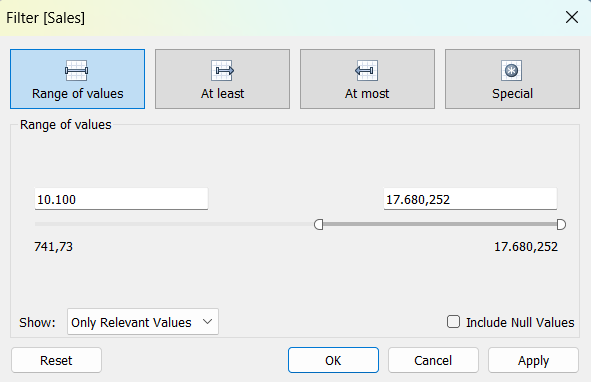
Looking at a bar chart of Sales by Sub-Category. You have some high performers like 'Labels' and 'Supplies', but a higher number of other categories that are cluttering the chart. You want to filter the view to only show Sub-Categories that have generated at least $10,100 in Sales.
What you actually do:
- Drag [Sales] measure to the Filters shelf.
- A dialog box appears asking how to filter. For a Measure Filter, select Sum (or other aggregation).
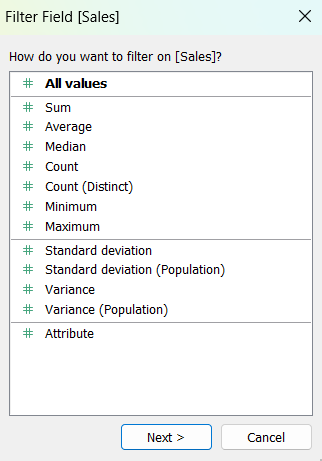
- Set the range and click OK.
The Pros
It's a good way to remove data points that are not relevant to the analysis.
The Cons
If used to hide categories, the Grand Total at the bottom of your text table will still include hidden values.
Table Calc Filter
The Explanation
Table Calc Filter is the only operation in Tableau that does not break the math. It is a visual filter.
Superstore Scenario
You have a line chart showing the Running Total of Sales from January to December. You decide you want to display only the values from July until December. Table Calc Filter hides January until June, but keeps their values in the background.
What you actually do:
- Create a calculated field using an if-function, which is a Table Calc. Formula: SUM(IF MONTH([Order Date]) >= 7 AND MONTH([Order Date]) <= 12
THEN [Sales]
END) - Drag this new calculation to the Filters shelf.
The Pros
Amazing for 'Top N' views where you want to hide certain ranks without recalculating the percentages of the other items.
The Cons
These filters can not be applied to 'All Worksheets' They are specific to the local worksheet your are working on.
P.S.: Conext filters are grey, Dimension filters are blue/green and Table Calc filters have a tiny delta symbol.