


Monday - Internal Project #2 Kickoff
Monday morning meant the kickoff for our second internal project at the Data School. This weeks brief was to create a suite of marketing dashboards, with which to explore emails and campaigns, leads, social media, and a general overview of the above. To do this, we were required to create our own data using Mockaroo. I was on the team for emails and campaigns. We spent most of Monday researching what fields marketing data normally consists of, what are the most important KPIs relating to emails/campaigns, and getting some inspiration for possible dashboards we could create. We also got started with creating the mock data in Mockaroo. To create realistic data, we also had to bring it into Alteryx in order to randomize some fields, create trends, and ensure that our figures were fairly realistic given industry estimates. For example, our original data had about 1billion marketing sent emails for a small start up over a year, which was extremely unrealistic, so I had to fiddle with the data in order to get the numbers to look more normal.
Tuesday - Project Time and Tableau Time
We spent Tuesday morning continuing with the work we had started on Monday - creating our mock data, and then creating a template for a dashboard that we could use for our final presentation.
We spent the afternoon getting stuck into more table calculations, and had our first go at a Workout Wednesday challenge (WOW). These are certainly a step up from some of the stuff I've been doing previously in Tableau, and I'm looking forward to getting stuck into more of these challenges.
You can see my attempt at one of the WOW challenges here:
Wednesday - Project Time, and an intro to LODs
Our dashboards really started coming together on Wednesday morning, and this was a great opportunity to play with functions that I hadn't used before, such as dynamic coloring based on whether a value is negative or positive.
LODs (level of detail calculations) were the topic of discussion for Wednesday afternoon. This session really pushed me to my mental limit, and honestly there were times were I felt like crying out of frustration. I just couldn't really get my head around them, and how to use them. I don't think this was made any easier by the pre-Christmas exhaustion that everyone in the office seems to be feeling. We'll have more sessions on this and I'm going to try practice them over the Christmas break, to try get my head around them.
Thursday - Presentation Day
Due to the fact that it is Christmas next week, and most people are off on holiday tomorrow, we had our presentation day pushed forward to Thursday. We spent the morning bringing everything together and adding some finishing touches to our dashboards. You can see my finished dashboard below:
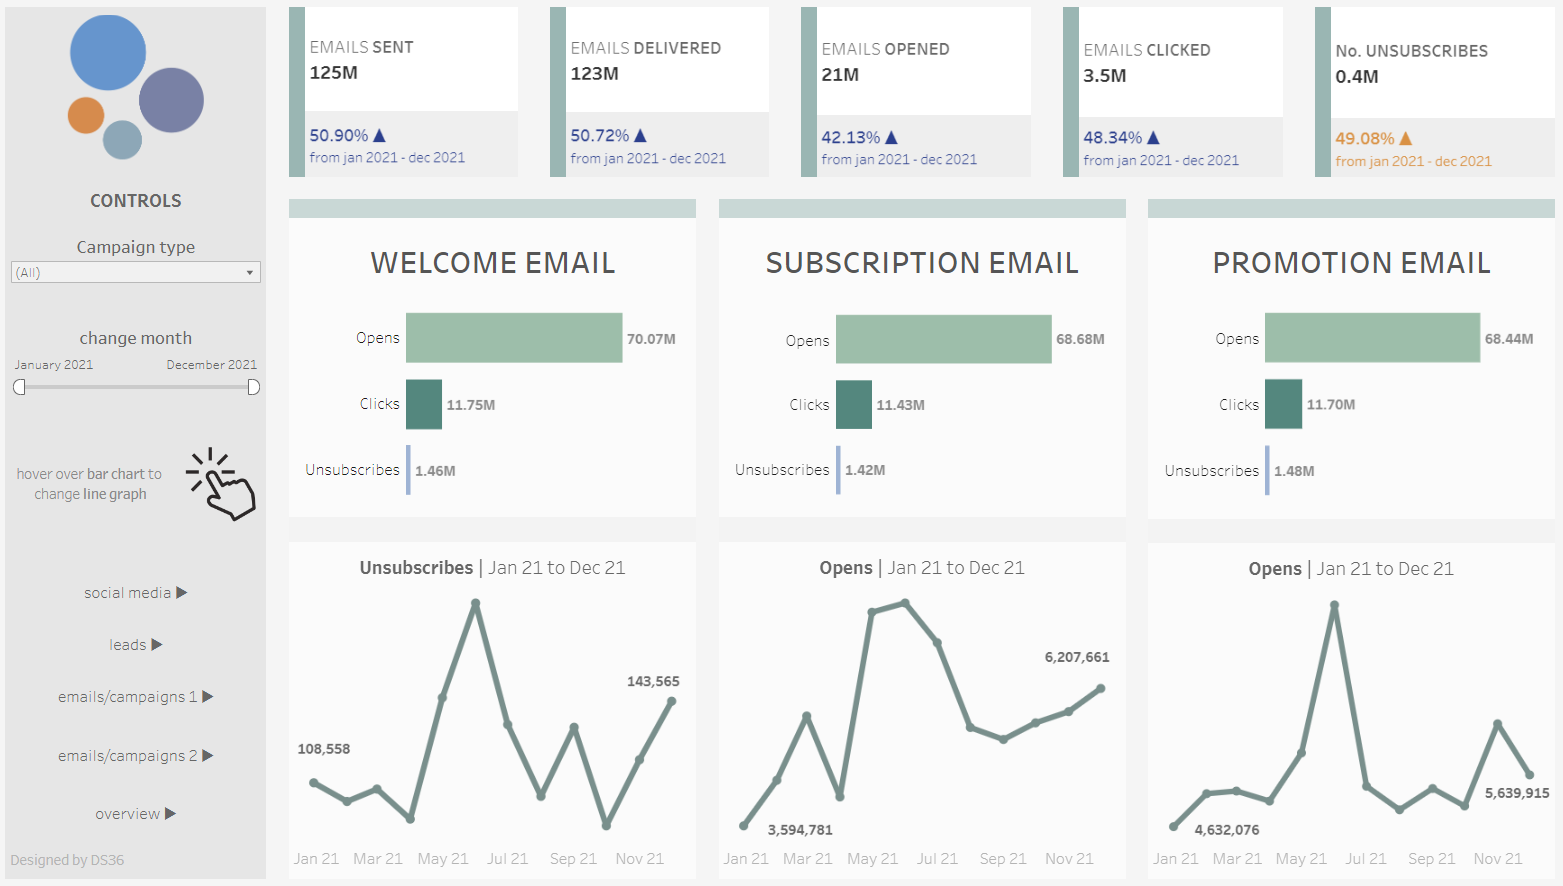
Our presentation went well. I'm feeling so much more confident presenting now. I'm super glad about this, because public speaking is always something that has made me extremely nervous (despite being a teacher for 2 years...). If you want some tips on presenting, check out my previous blog!
Friday - Nearly Christmas!
Tomorrow is a 'personal project day' for us, as will be the days between Christmas and New Years Eve. I'm excited to use this time doing some Preppin' data challenges, re-attempting my Alteryx Core exam, and building up some nice vizs on my Tableau Public. We'll also be running a Learn What The Data School Learns session after Christmas, so I'll definitely be devoting some time to planning this too.