I'm starting a new series of blogs on table calculations, in which I will be taking you through Tableau's 7 main table calculations, one by one, using the Superstore data in Tableau. These will be Running Total, Difference, Percent Difference, Percent of Total, Rank, Percentile, and Moving Average. Todays blog will be looking at Running Totals.
What is a Running Total calculation?
A running total table calculation basically aggregates the values of a field cumulatively i.e. the value of one column or row, is added to the total value of the columns and rows that came before it.
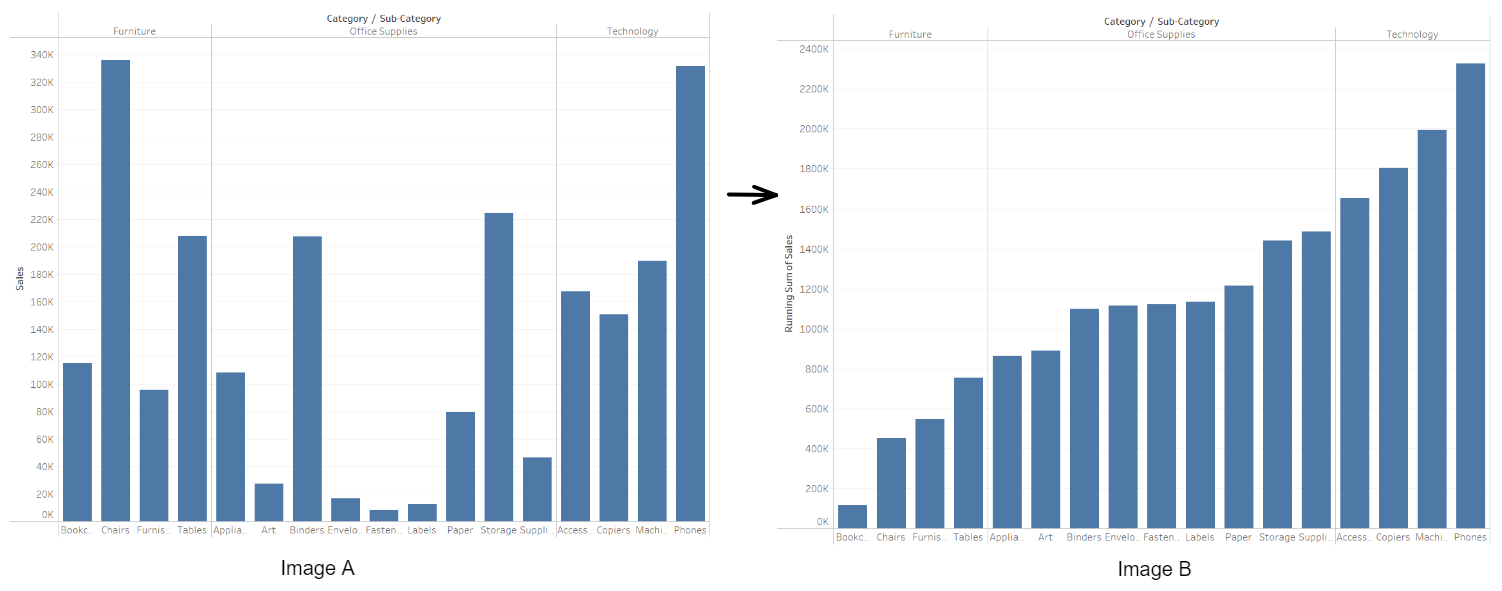
Using the example above, a running total calculation is applied to the sum of sales, which is split by subcategory. This means that, instead of each bar showing the sum of sales per single sub category (Image A), each bar shows the sum of sales for a sub category in addition to the sum of sales for all the sub categories before it (Image B).
To visualize this better, take a look at Image C. This shows the running total of sales by subcategory, just as in Image B. Looking at the second column, for the subcategory 'Chairs', we can see that the portion of the bar that is orange represents the sum of sales for chairs, whilst the portion of the bar that is blue represents the sum of sales for the categories before, in this case 'Bookcases'.
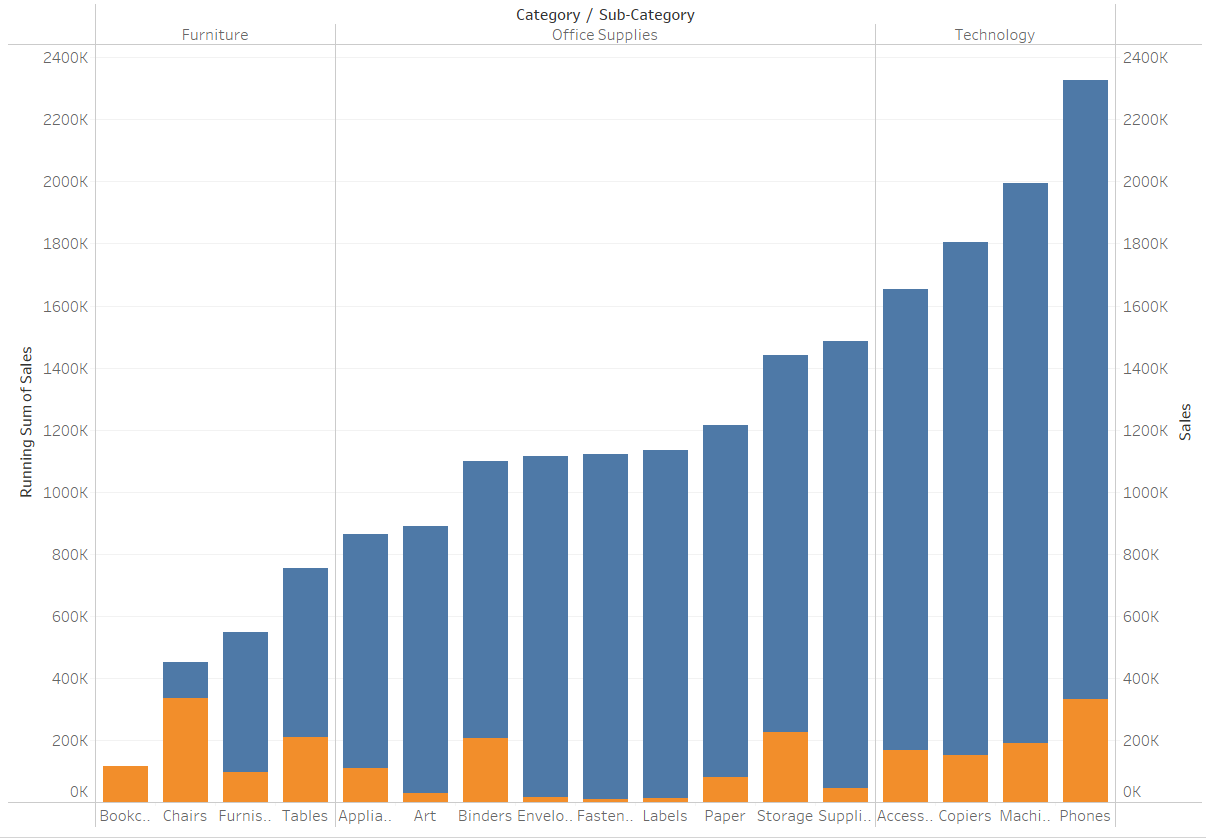
This is helpful in visualizing how a running totals calculation (aggregating by sum), works.
Running Total - Basic Quick Table Calc
Now we are going to go through how to create a running total calculation, using quick table calcs. Using the superstore data in Tableau, we want to see the running total of the sum of profit, by country and region.
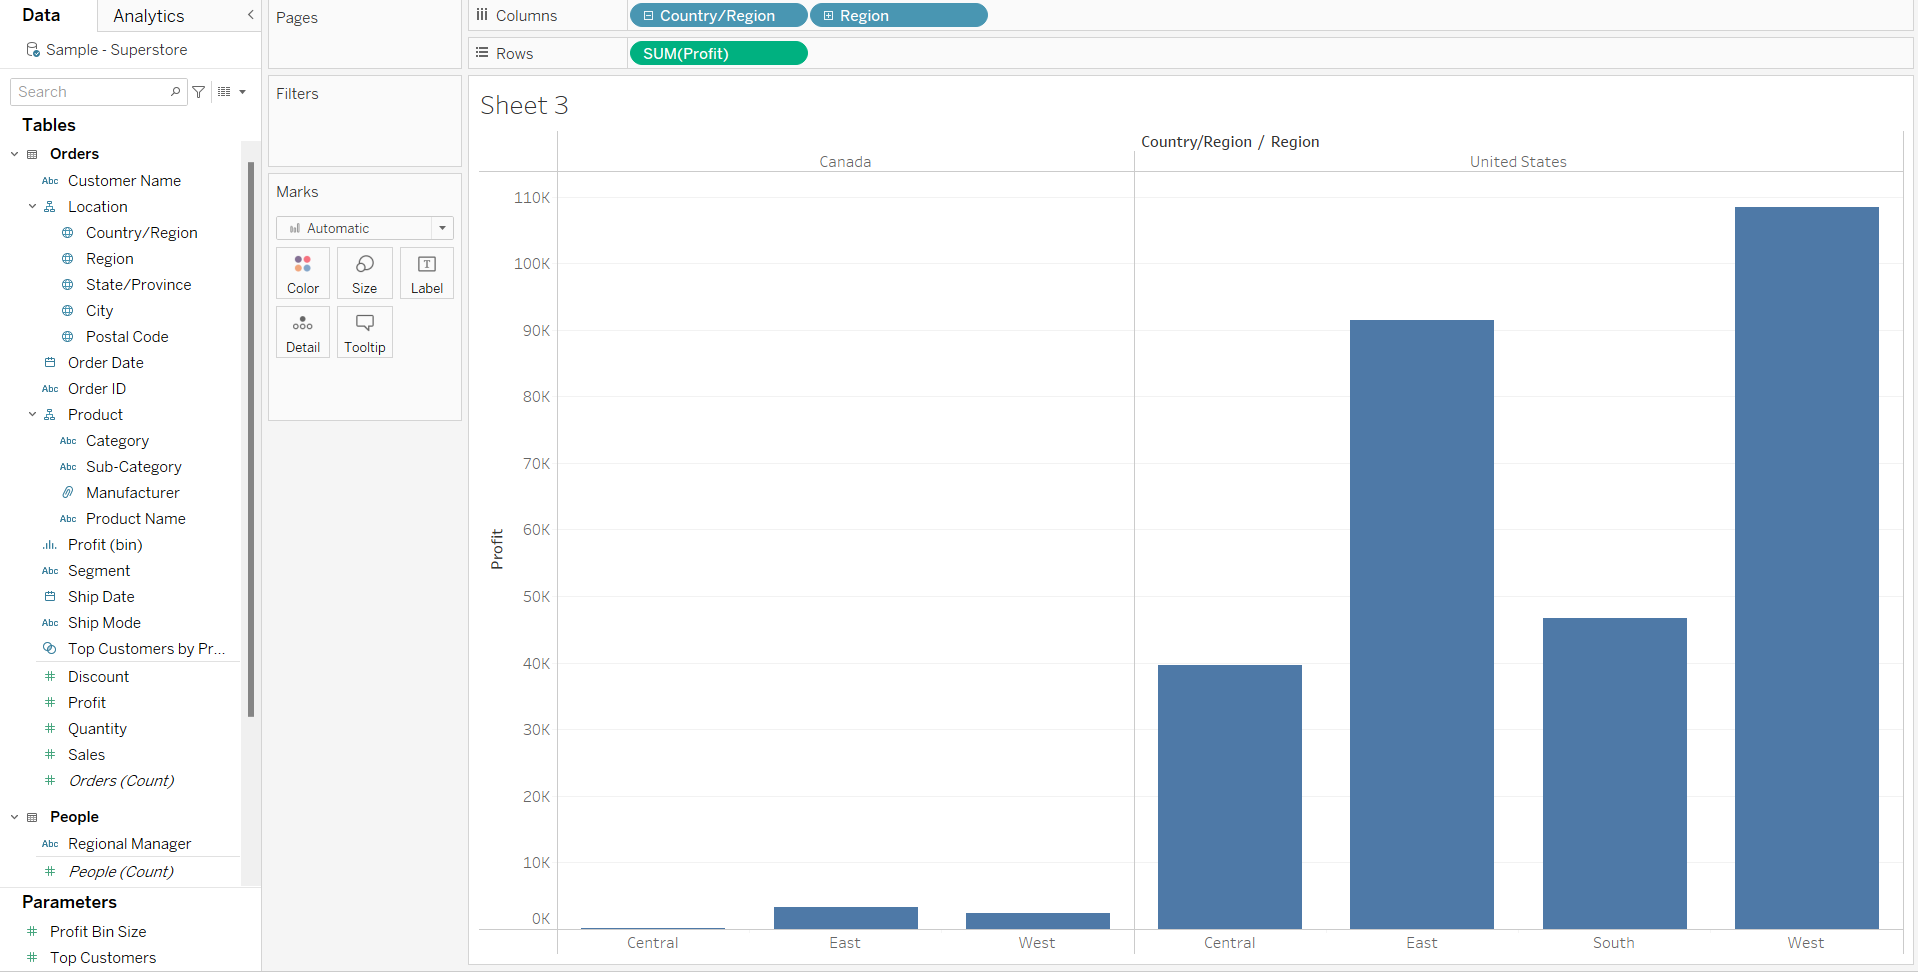
To start, we are going to drag the 'Country/Region' and 'Region' fields into our columns bar. Next, we want to drag the 'Profit' field into our rows bar, and if it doesn't automatically select Sum(Profit), change this accordingly. Our view should now look as follows:
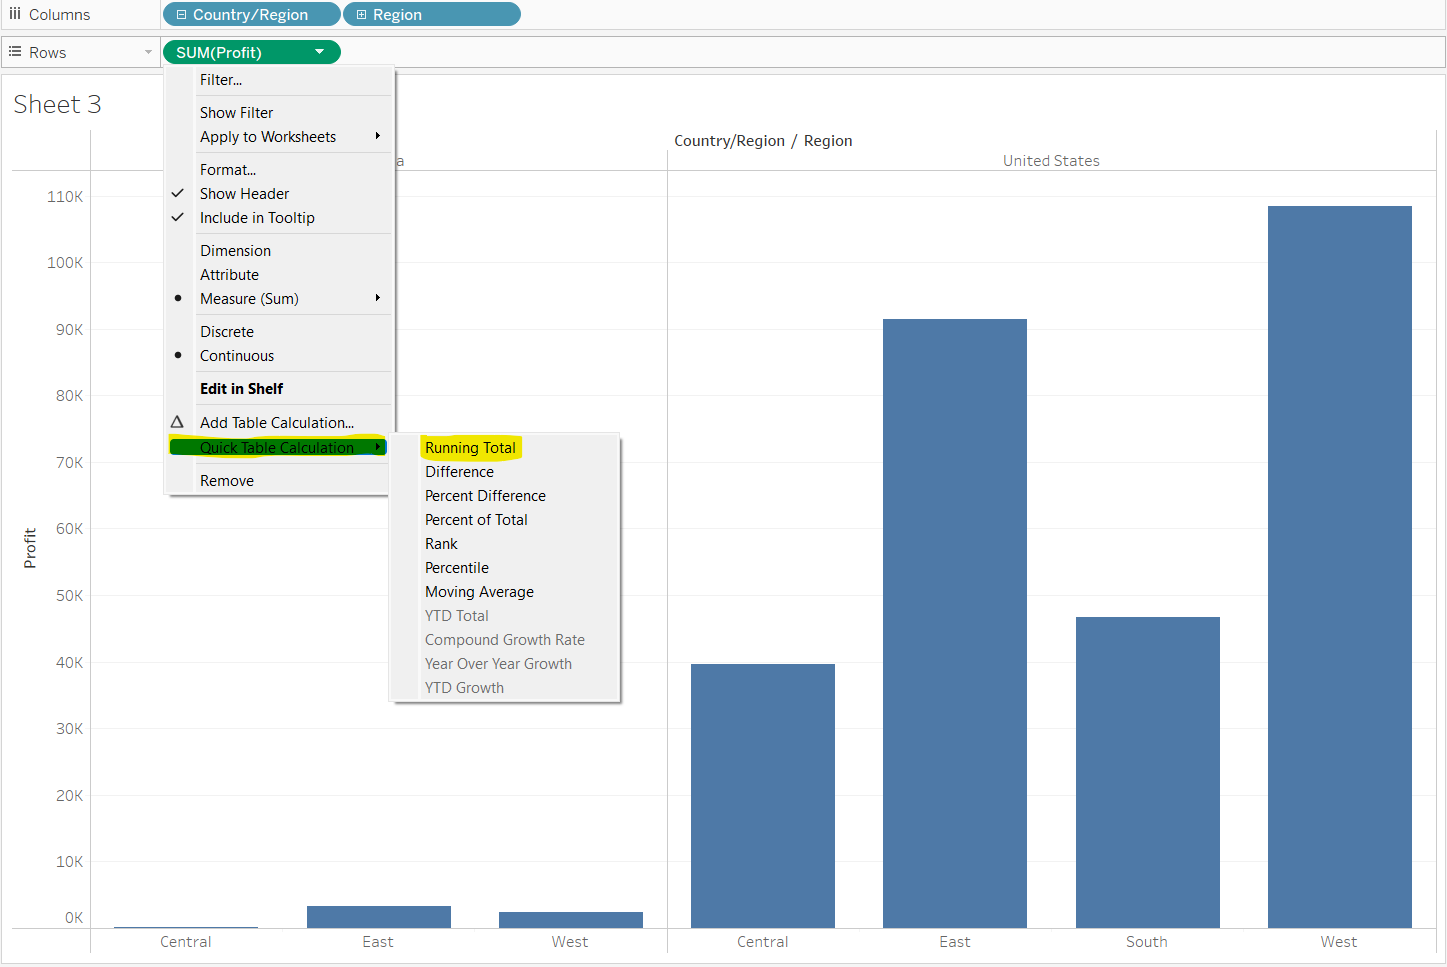
We now want to create our table calculation. To do this, we want to click the drop down menu from out SUM(Profit) pill, select 'Quick Table Calculation', and then select 'Running Total', as shown below.
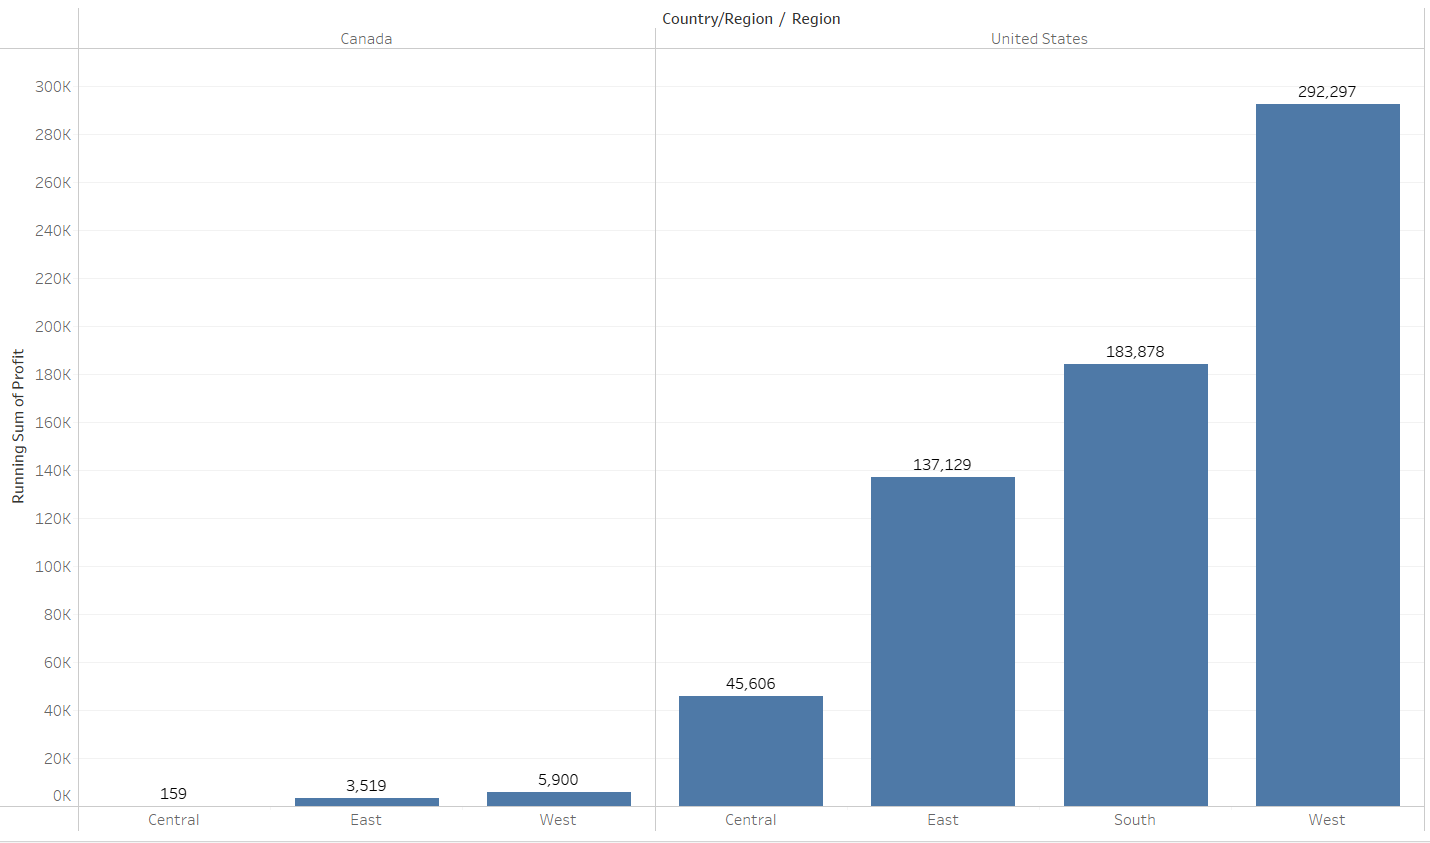
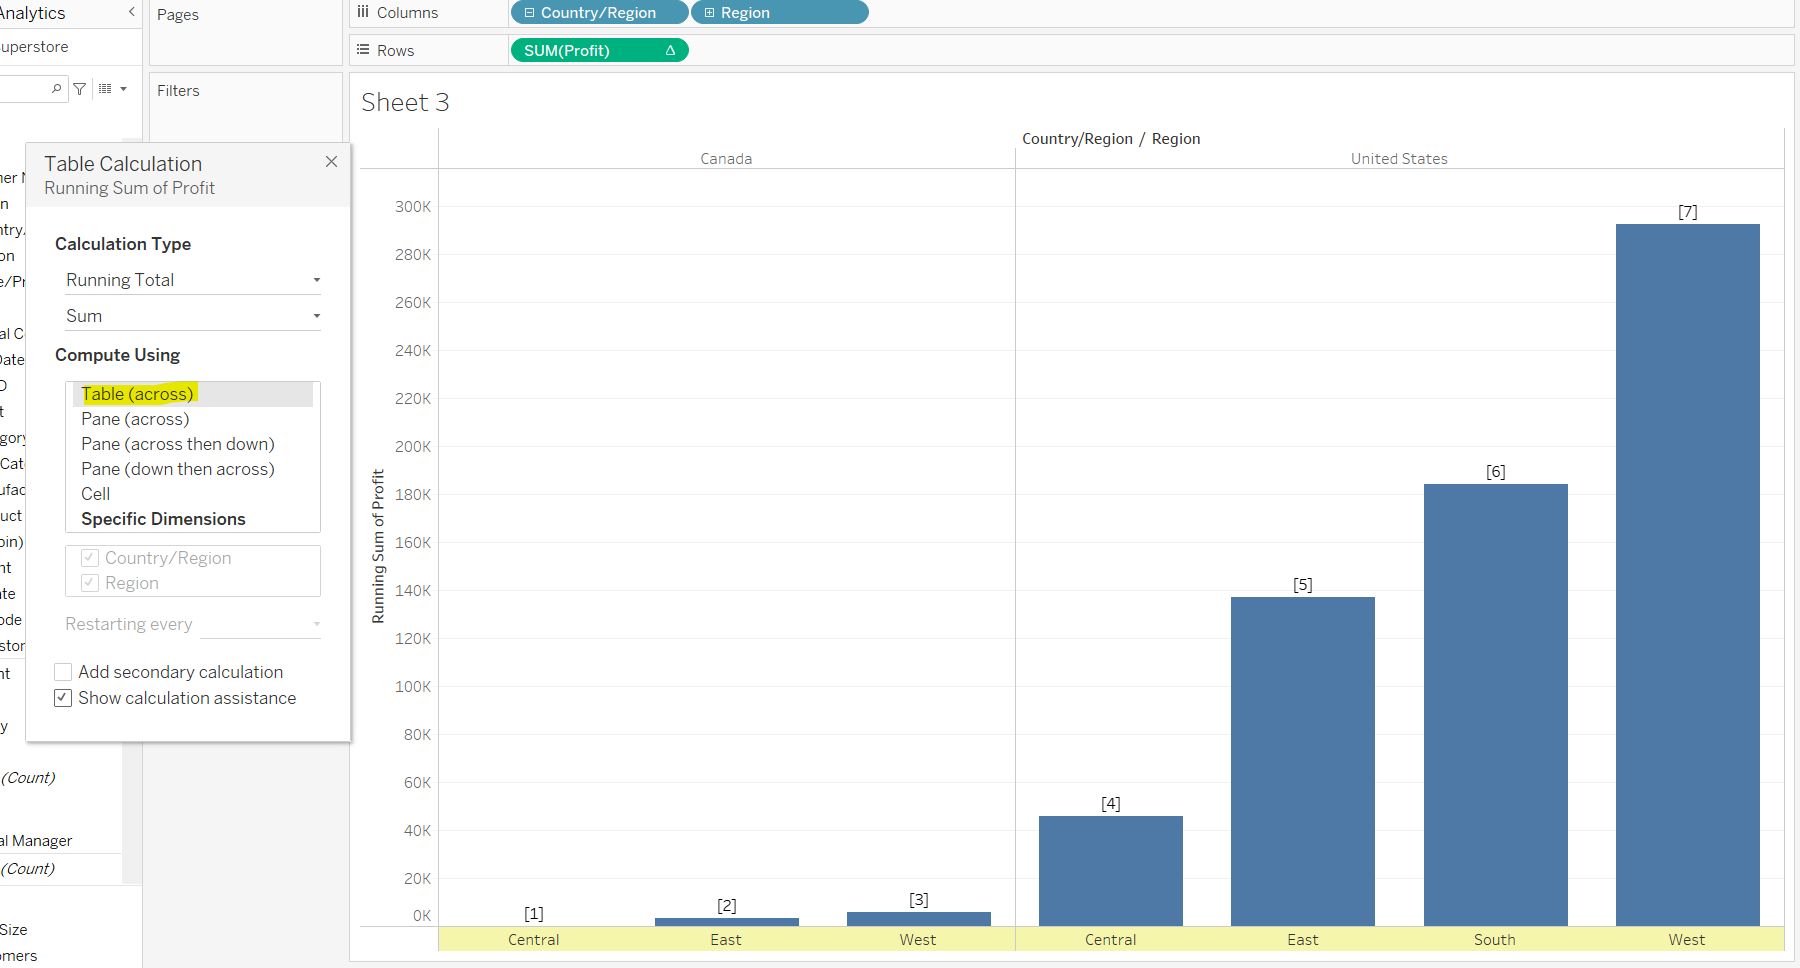
And that's as simple as it is! You have created a running total quick table calculation. You should be left with the following graph (I've added mark labels too), showing the running total of the sum of sales, by country and region:
Running Total - Advanced Table Calc
You've created a running total using a quick table calc, which as the name suggests, is quick and easy, but doesn't give you so much control over how you want the calculation to run.
Say you want to look at the running total of profit by country and region as before, however this time you want the running total to reset for each country. This requires a little more work than our quick table calculation above. We need to edit our quick table calculation.
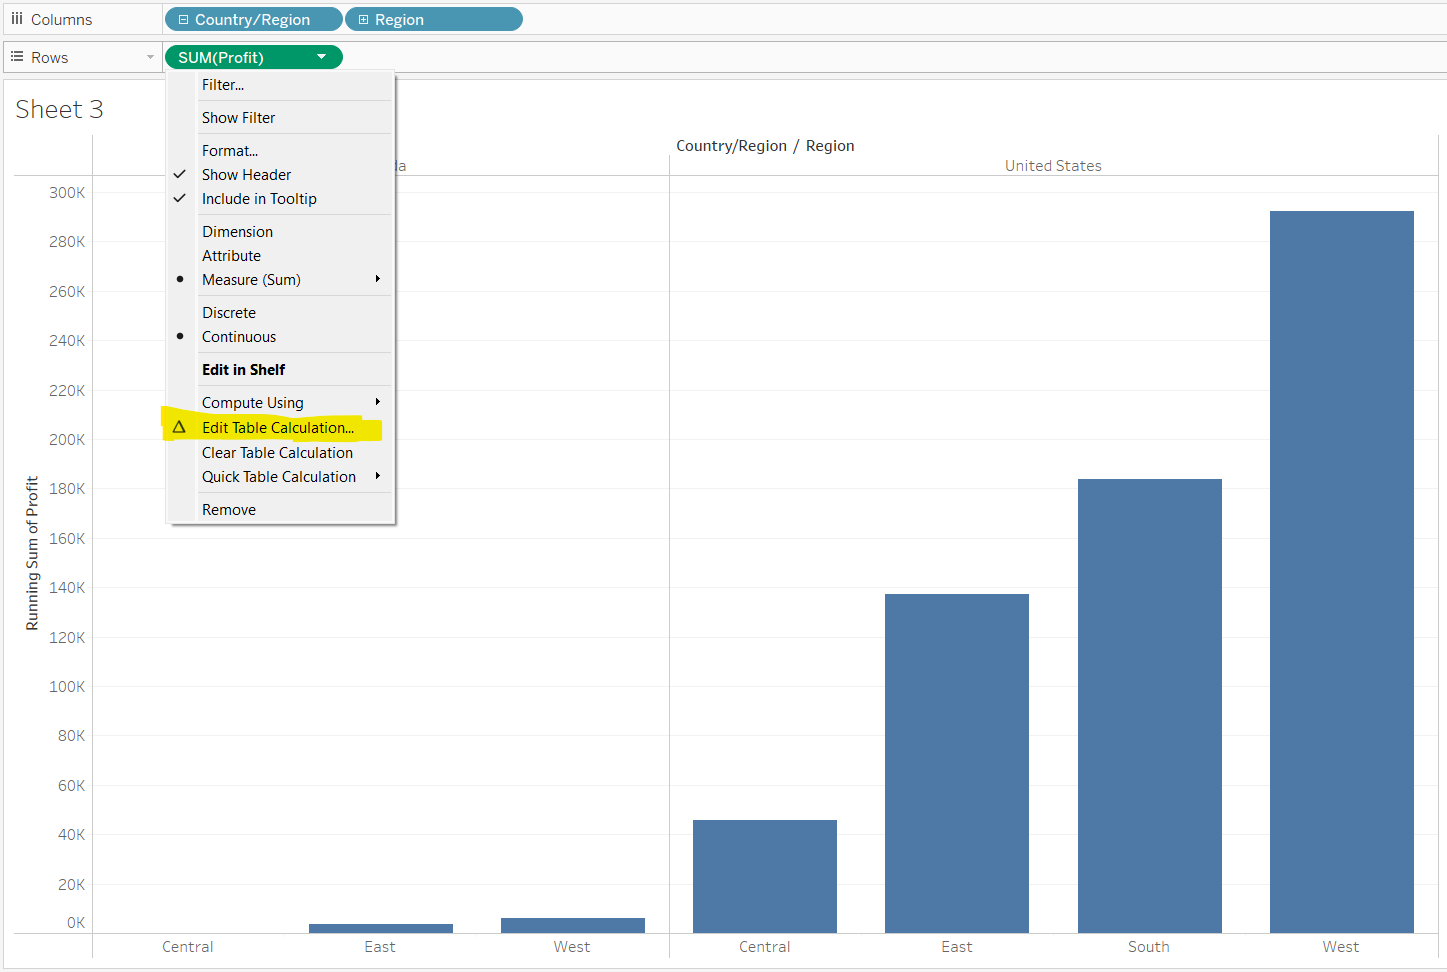
Starting where we left off, we want to bring up the drop down menu on SUM(Profit), and select 'Edit Table Calculation'.
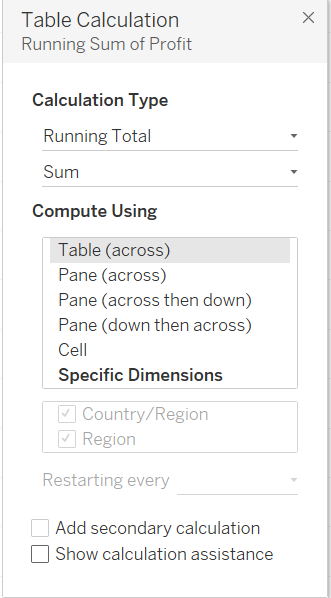
This will bring up the following box:
Calculation Type
This box allows us to change 'Calculation Type' according to type of calculation.
For 'Running Total' calculation types, we also have the option of changing whether we want to compute our running total using the sum of a value, the average, or the minimum or maximum value.
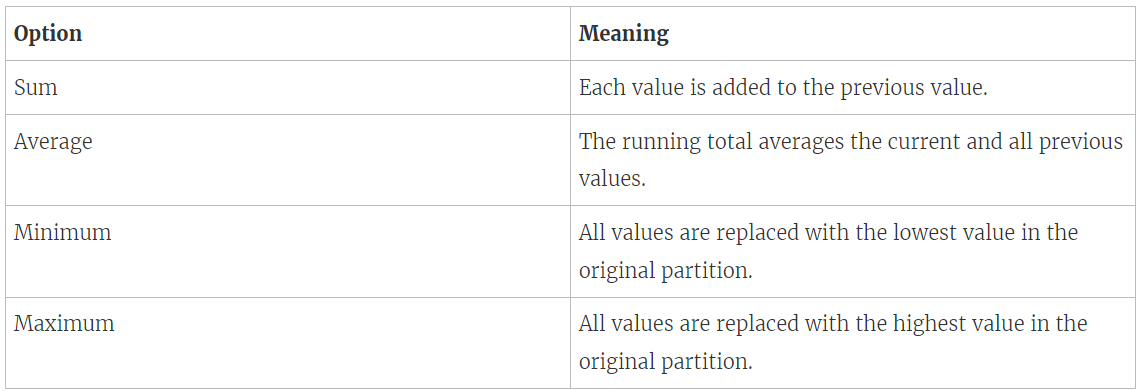
Tableau explains the difference between these options as follows:
Compute Using
The next way that Tableau allows us to change our table calculation, is by 'Compute Using'. This basically allows us to change the way in which table calculates the running total.
Table (across) means that Tableau works out the running total by looking at all the columns in the table, from left to right. If we put our profit pill in Columns, instead of rows, then this would change to Table (down), meaning that Tableau would work out the running total by looking at all the rows in the table, from top to bottom.
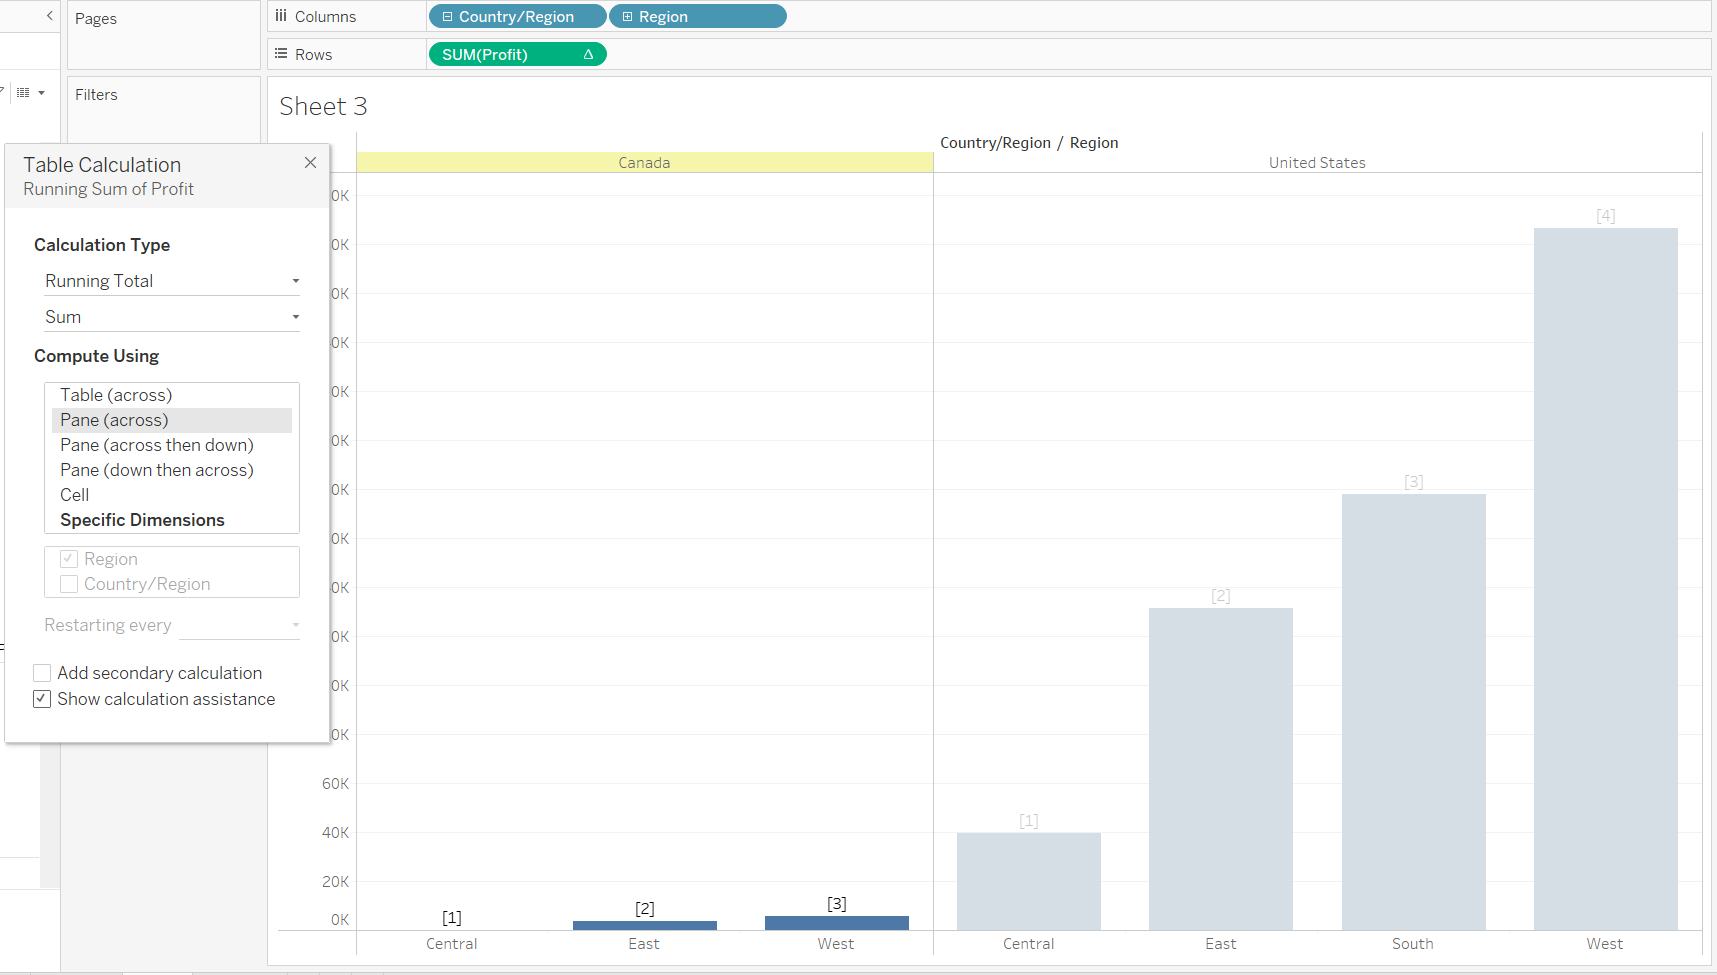
Pane (across) means that Tableau works out the running total by looking at all the columns within a pane i.e. all the columns within the Country field, and then restarting for the next pane. Again, if we put our profit pill in the columns bar instead of the rows bar, then this would change to Pane(down), and tableau would work out the running total by looking at all the rows within a pane, restarting every pane.
Pane (across then down) and Pane (down then across) don't change anything in this view, but can be useful when creating a table, as opposed to a bar chart.
One of my colleagues Erica Hughes has a great viz explaining this in more detail. You can find it here: https://public.tableau.com/app/profile/erica.hughes/viz/TableCalculationConfigurationGuide-INTERMEDIATE/Homepage
Finally Cell means that Tableau works out the running total, restarting at every cell, which effectively leaves us with the same graph as we would have if we didn't apply a table calculation.

Specific Dimensions
The final option Tableau gives us in changing how it works out the running total table calculation, is using 'Specific Dimension'.
This is an extension of Compute Using, and basically allows us to decide how tableau computes the running total, depending on what fields we have in our view.
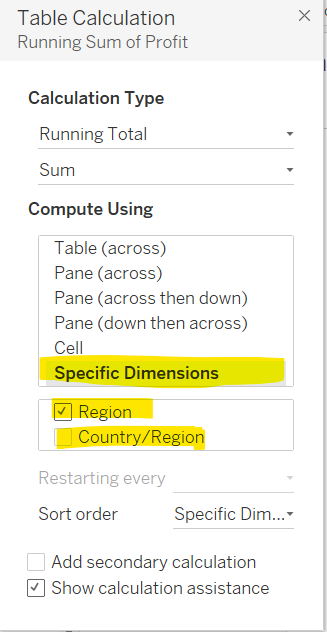
This is where things get a little tricky, because how we expect this to work is somewhat contradictory to how it actually works.
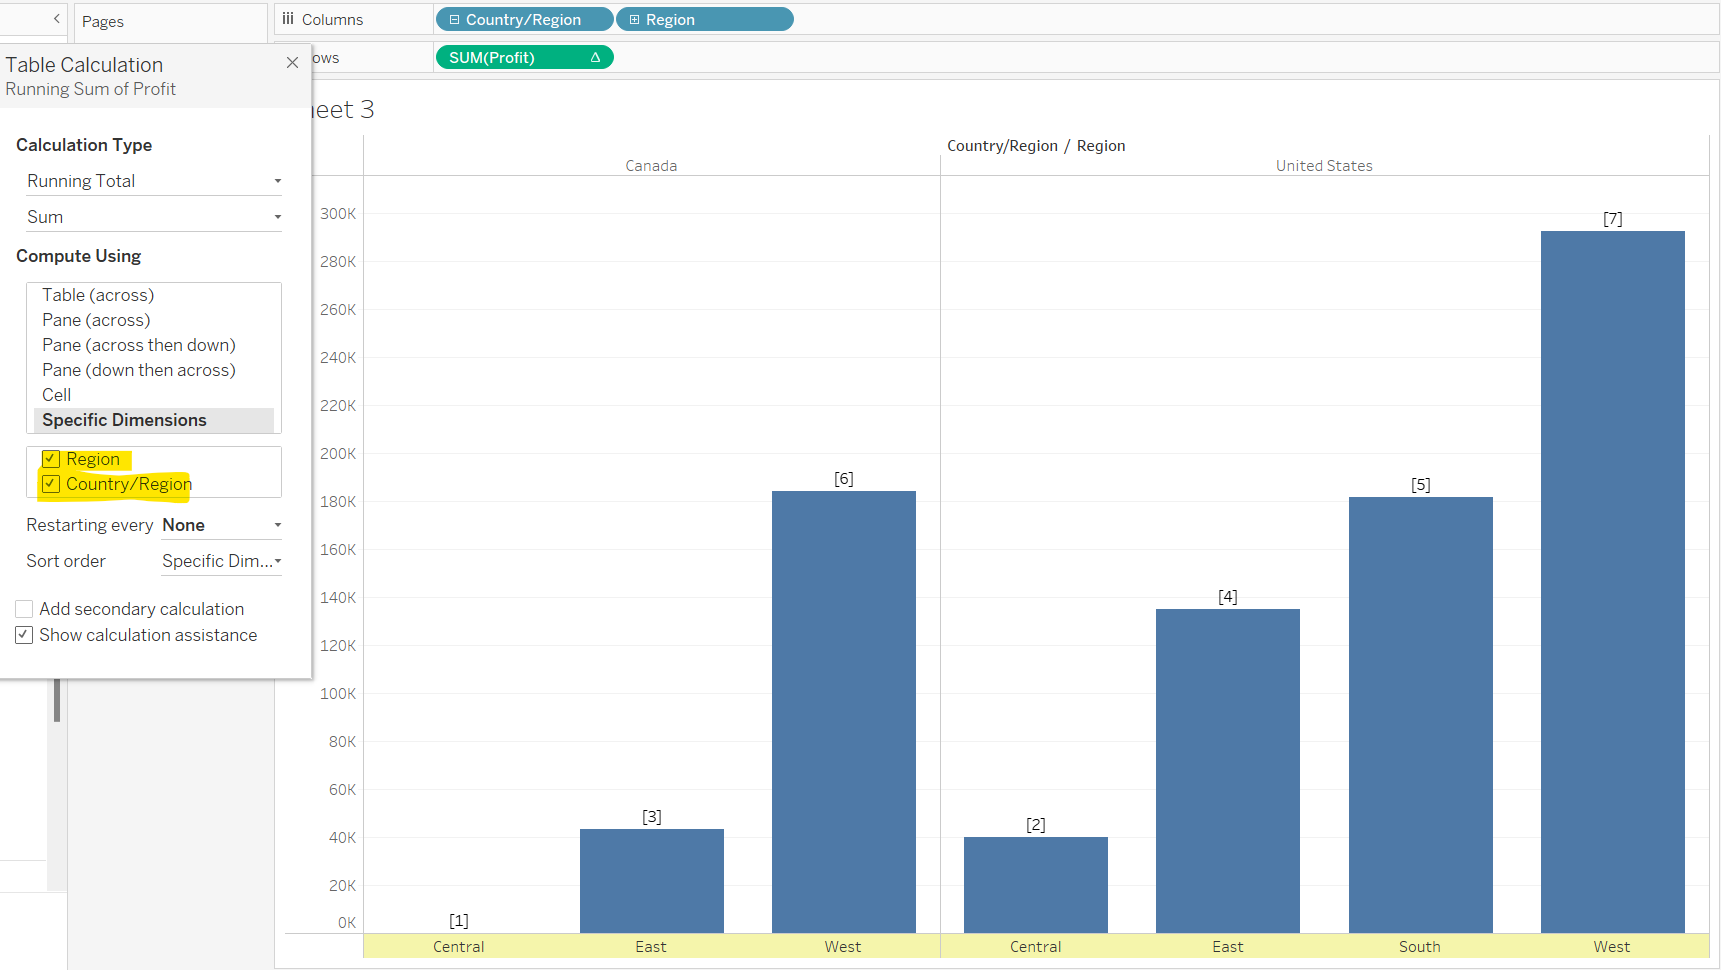
When you select a specific dimension, in this case 'Region', what you are effectively telling Tableau is to work out the running total for Region, resetting at the every Country/Region level. In effect, Tableau will reset the level it works out the table calculation for the dimensions that are unticked (contrary to what you may expect).
If we untick Region, and tick only 'Country/Region', what Tableau is now doing, is working out the running total for 'Country/Region', restarting every 'Region'. This means that Tableau is effectively summing the regions together for both countries. i.e. 'Central' in 'Canada' is added to 'Central' in the 'US'. There is no 'South' in 'Canada' so it only looks at 'South' in the 'United States'.
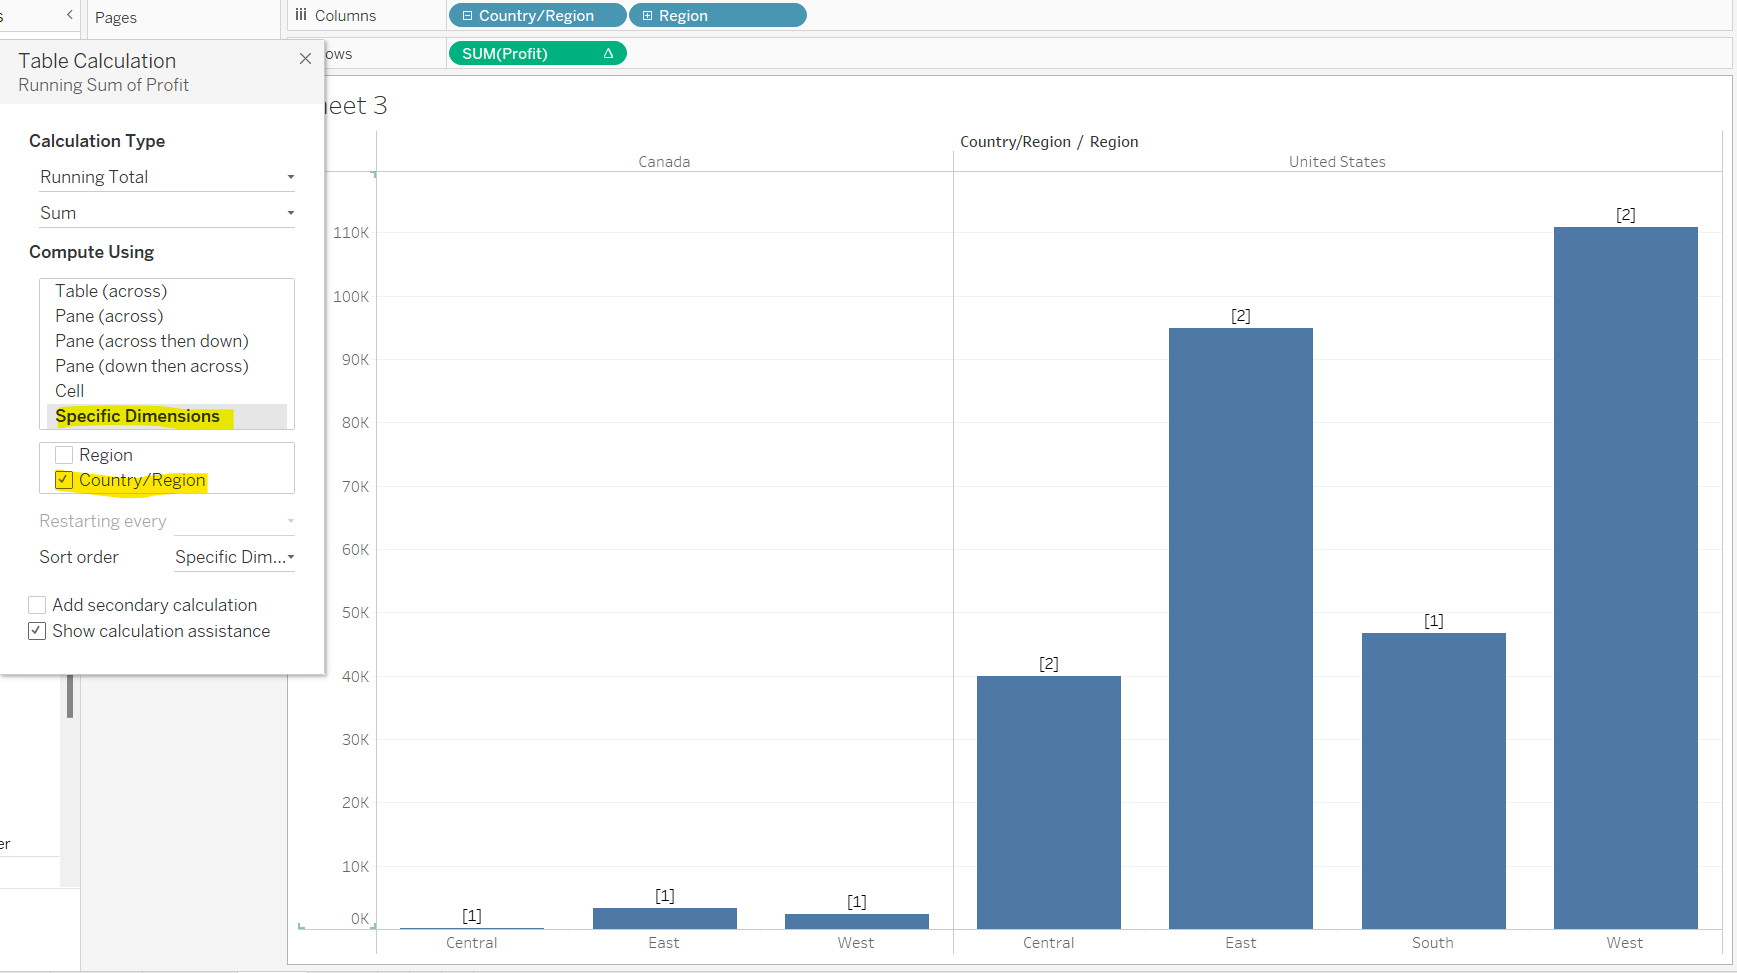
If we selected both 'Region' and 'Country/Region', then Tableau will work out the running total by first looking at 'Region', and then looking at 'Country/Region'. It starts with 'Central', looking for this value in both 'Canada' and then 'United States', then going onto 'East', and so on.
Back to the Task!
Now, as we said before, we want to create a running total of profit by country and region, resetting for each country. We can do this one of two ways. The first way would be to compute our table calculation using Pane(Across), which as mentioned before, means that tableau works out the running total restarting at each pane, i.e. each country.
The second way would be to select 'Specific Dimensions', and select 'Region', but leave 'Country/Region' unticked. This means that Tableau will work out the running total of region, restarting every Country/region.
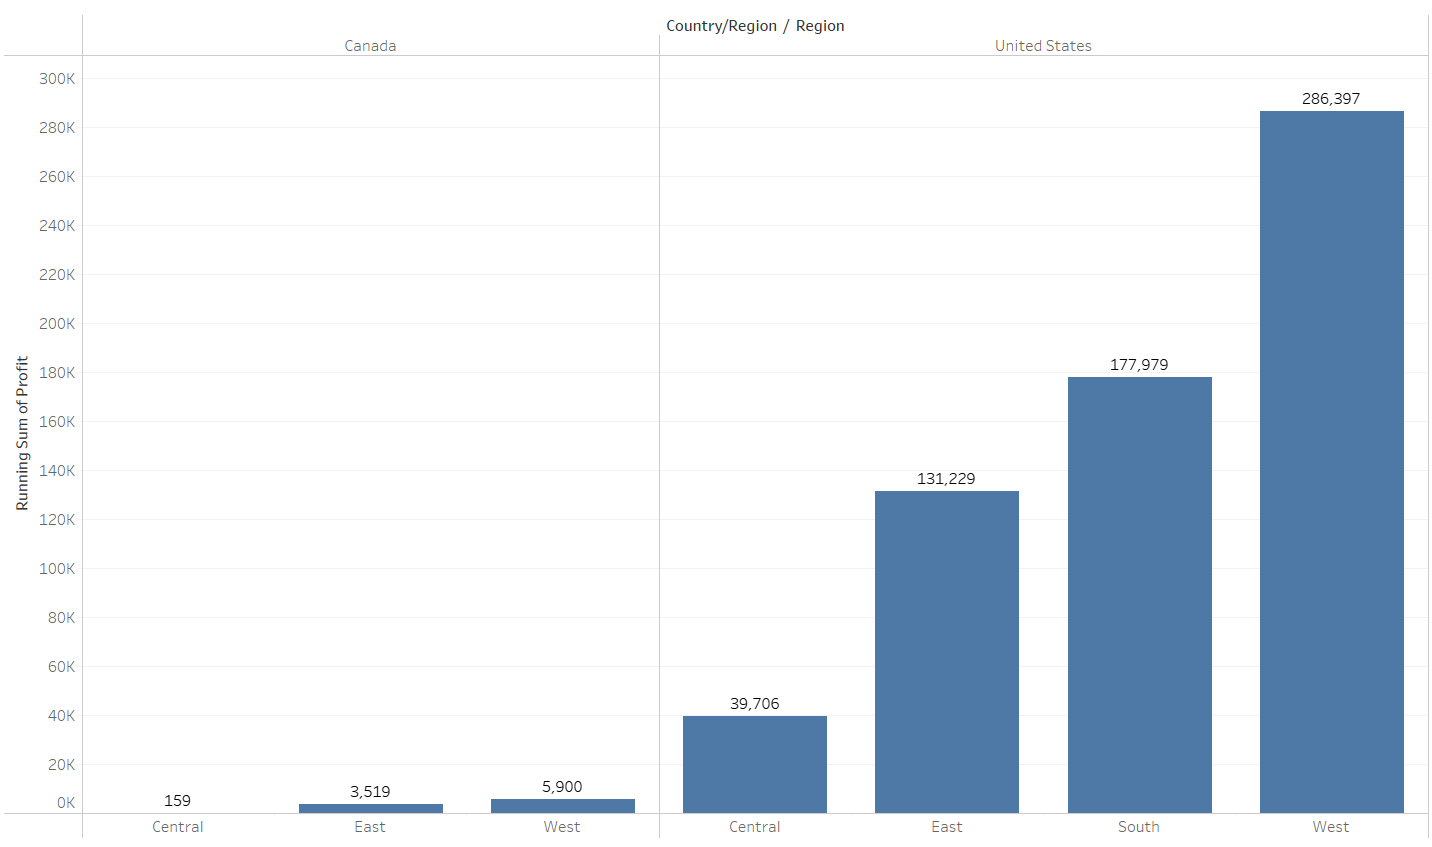
Whichever option you chose, you should be left with the following graph. Notice how the marks numbers are different to that of the graph created using a basic quick table calculation, indicating the difference in the two graphs.
And that's it! You should now feel confident creating a running total using a quick table calculation, and then changing your running total using the edit quick table calculation option.
Keep your eyes peeled for my next blog on table calculations, where I'll be going into 'Difference'.
