This is the second blog in my series on Tableau Table Calculations. This time we will be going through Difference (from). As in my previous blog, the data I will be using is Tableau's Superstore dataset.
What is a Difference calculation?
For a difference calculation, or difference from calculation, Tableau works out the difference between the current value and another value in the view.
Let's take the following example.
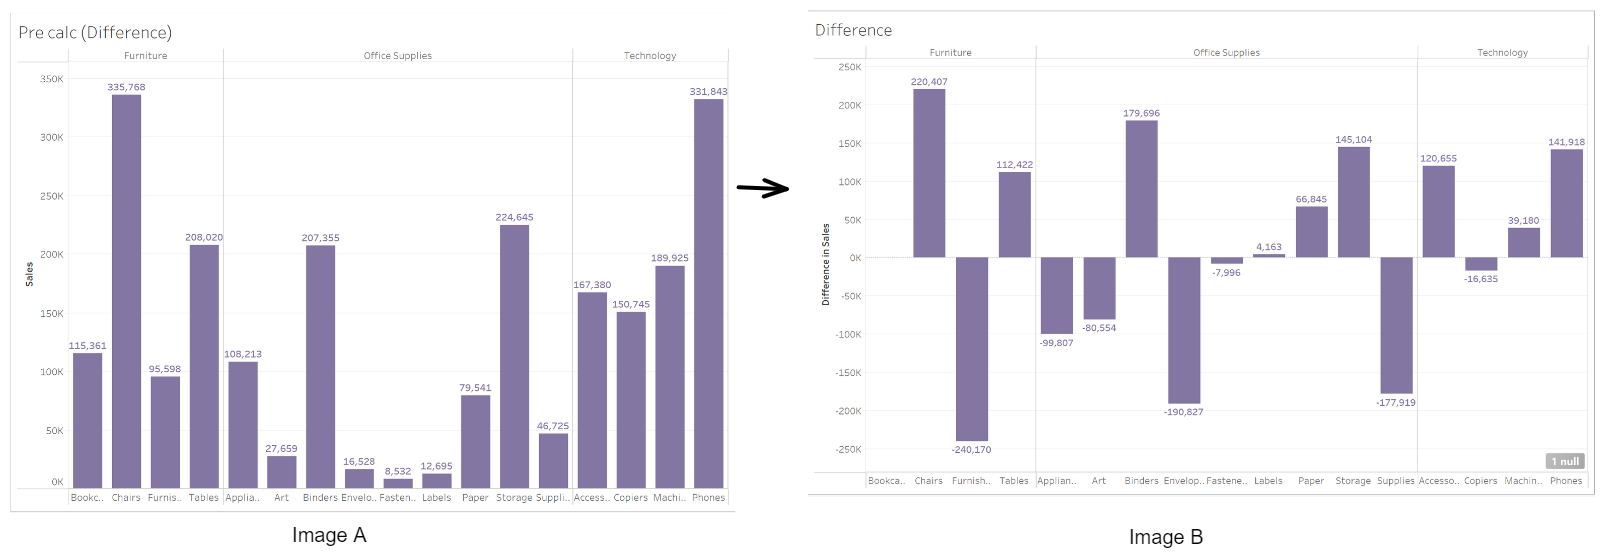
Here, a difference calculation is applied to the sum of sales, which is split by category and subcategory. In Image A, each bar shows the sum of sales for a subcategory. In Image B, each bar shows the difference in the sum of sales, between that subcategory, and the one before it.
For example, looking at Table A, we can see that the sum of sales for 'Binders' is 207,355 whilst for 'Art' it is 27,659. The difference in sum of sales for 'Binders' will therefore be the difference between 207,355 and 27,659, which is 179,696. This is the value shown for 'Binders' in Image B.
Looking at Image B, we can see that there is 1 null (shown in the bottom right corner). This null will be our first value. As there are no previous values for this column, no difference can be calculated, resulting in a null.
Difference - Basic Quick Table Calc
Okay. We know what a difference calculation is, now lets get to work creating one. Let's say we want to look at the difference in total profit by month, for 2021.
We'll start by right-dragging 'Order Date' into our column bar, and selecting continuous 'Month'. We only want to look at 2021, so let's also drag 'Order Date' into the Filters tab, selecting 'Years', and then selecting '2021'.
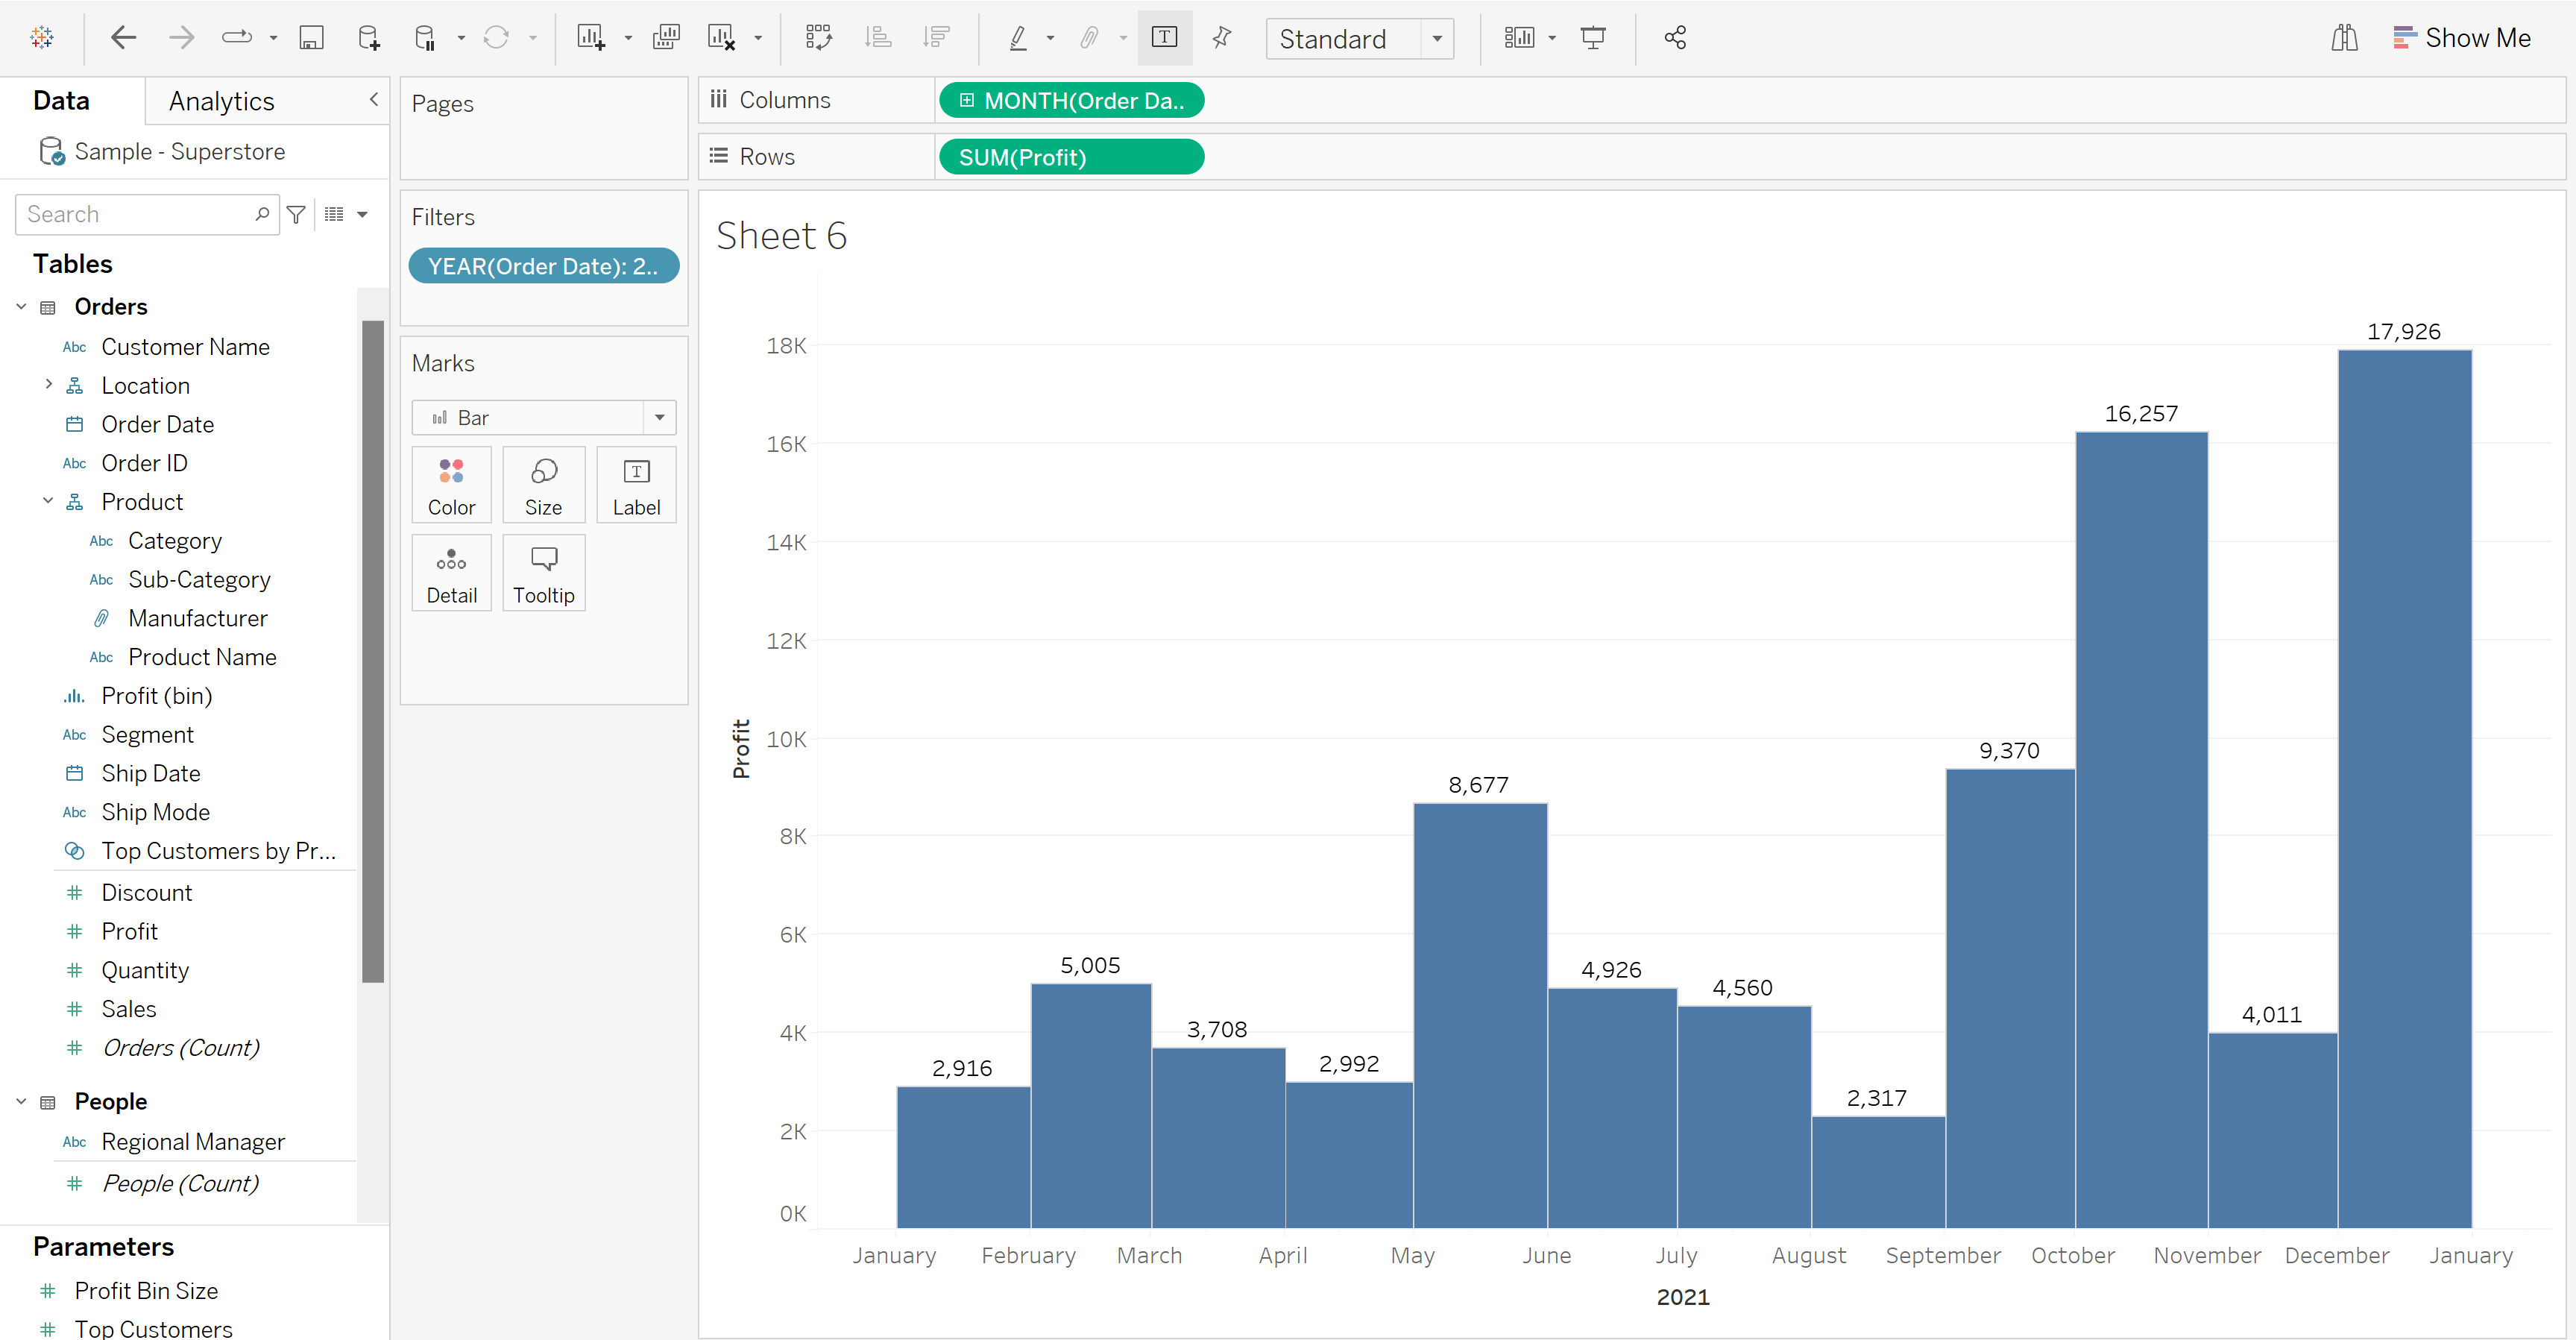
Next, drag 'Profit' into the rows bar, and if it doesn't automatically set to SUM(Profit), change it accordingly. Change the graph type to 'Bar' in the Marks card. I'm also going to turn on the mark labels for my columns. You should now have a chart that looks like this:
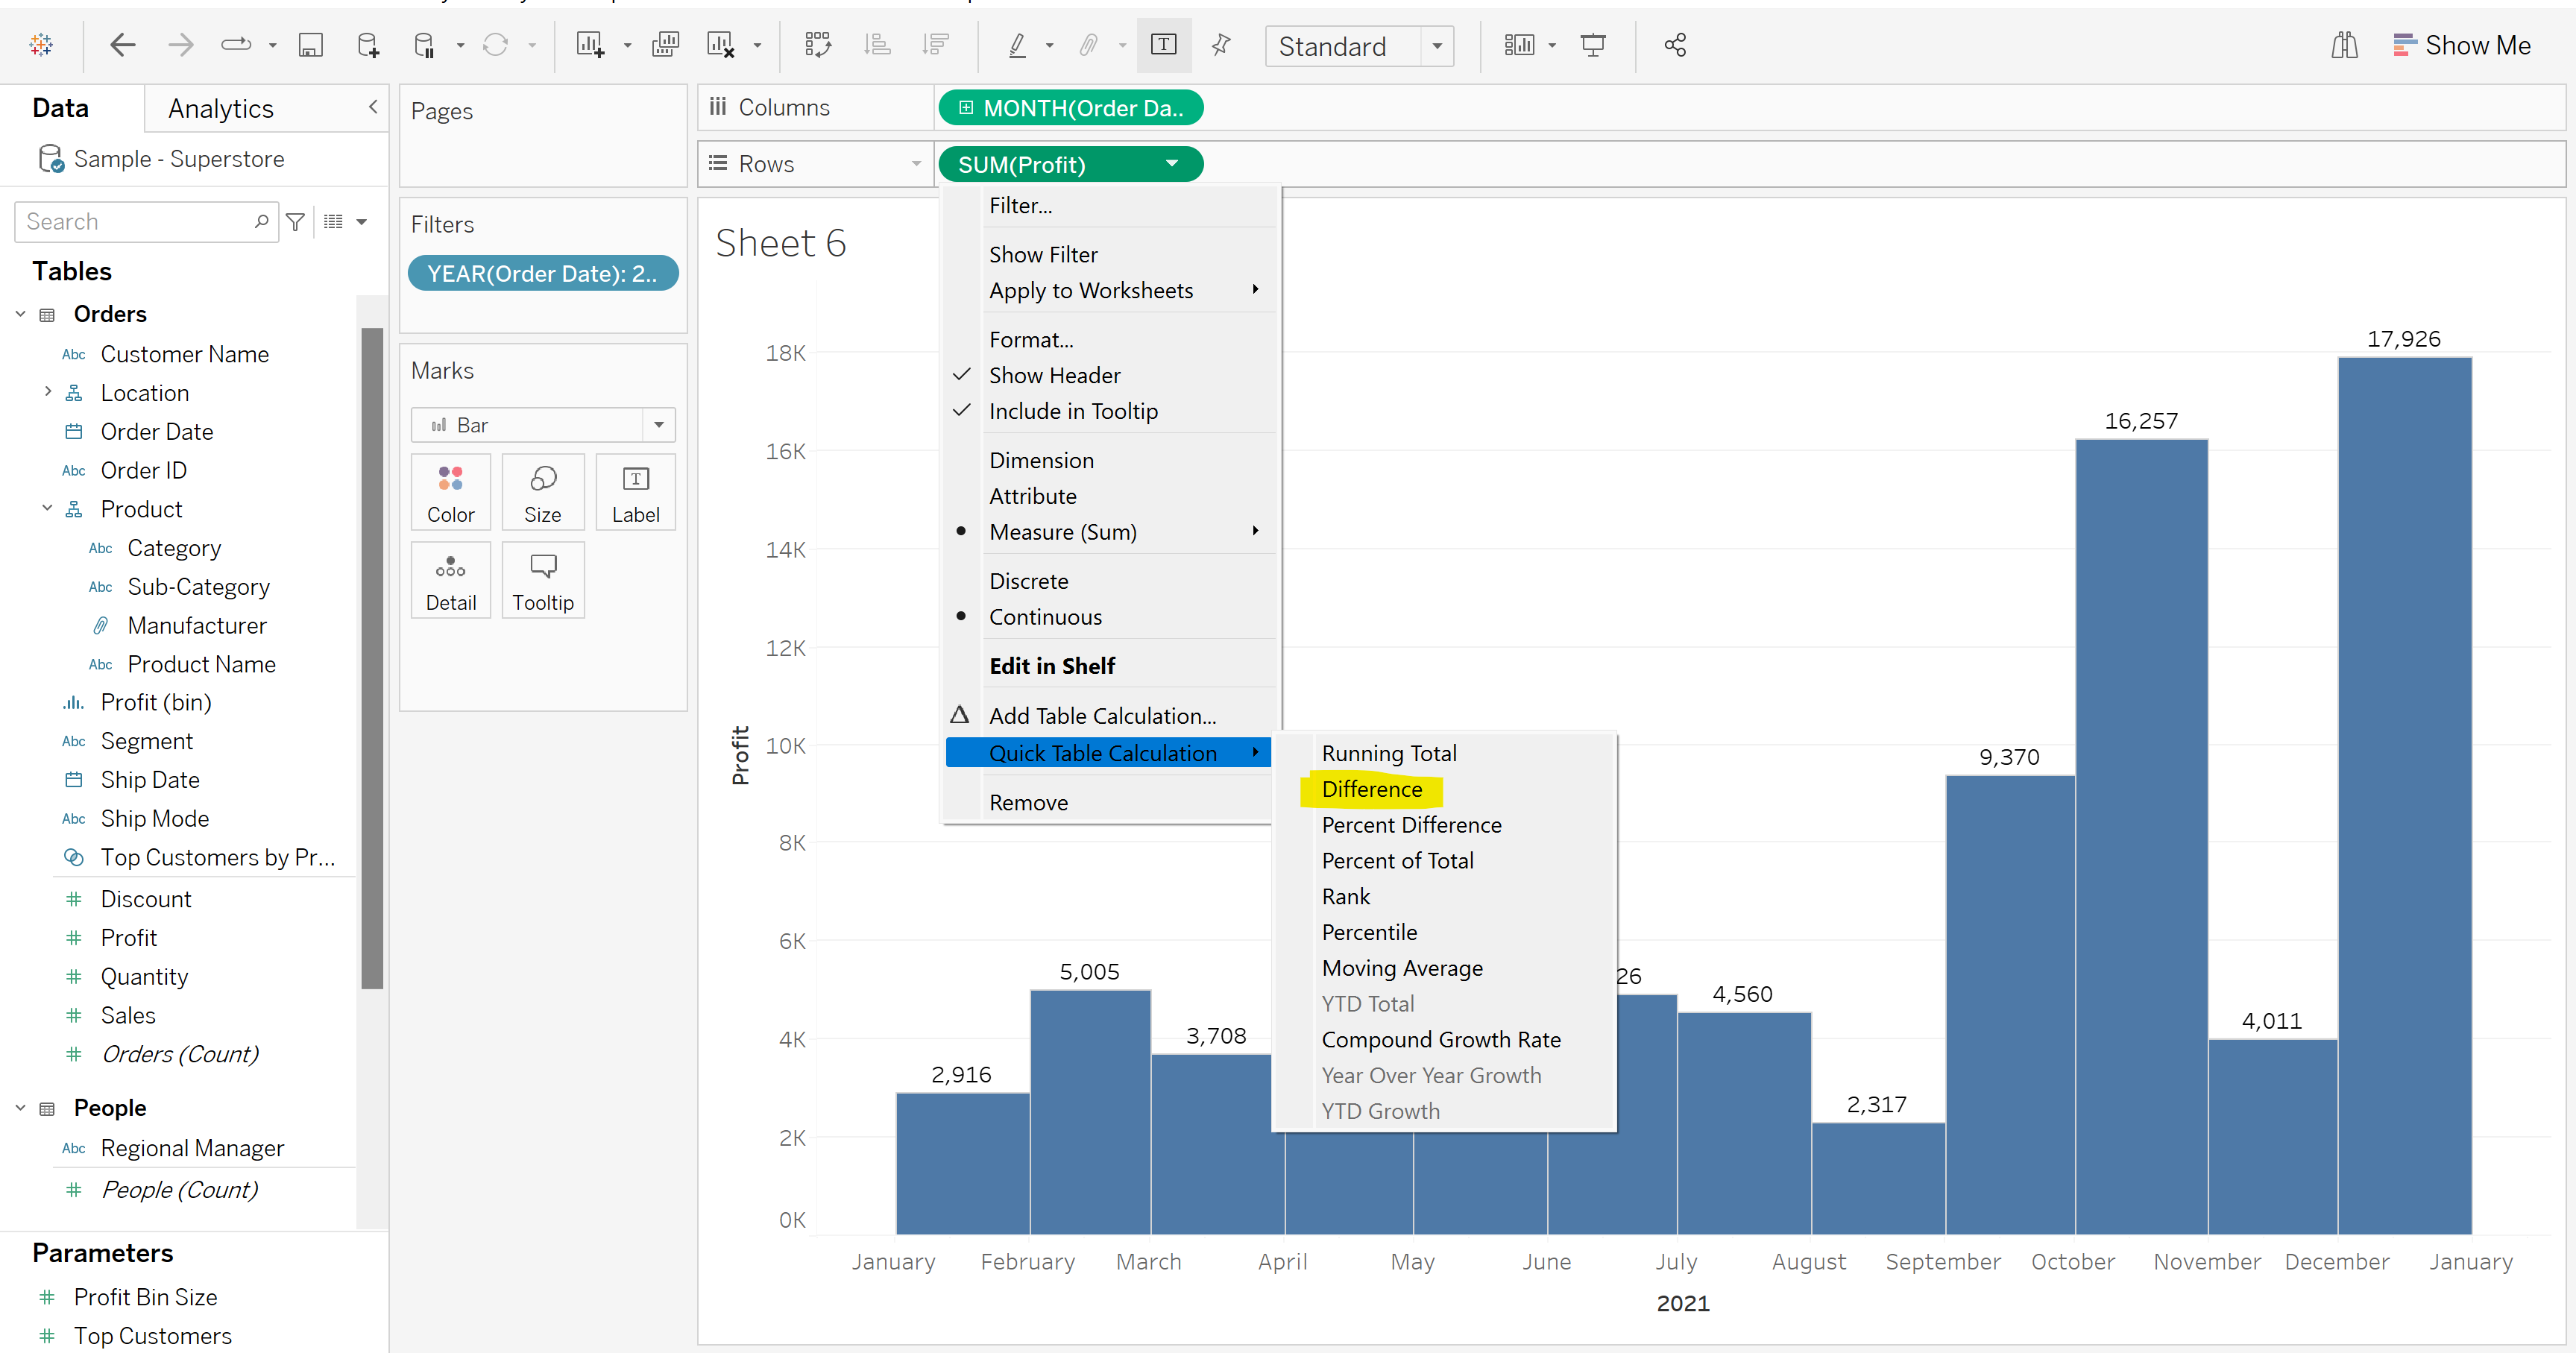
Now we want to add our quick table calculation. Right-click on the SUM(Profit) pill, select 'Quick Table Calculation' and then select 'Difference'.
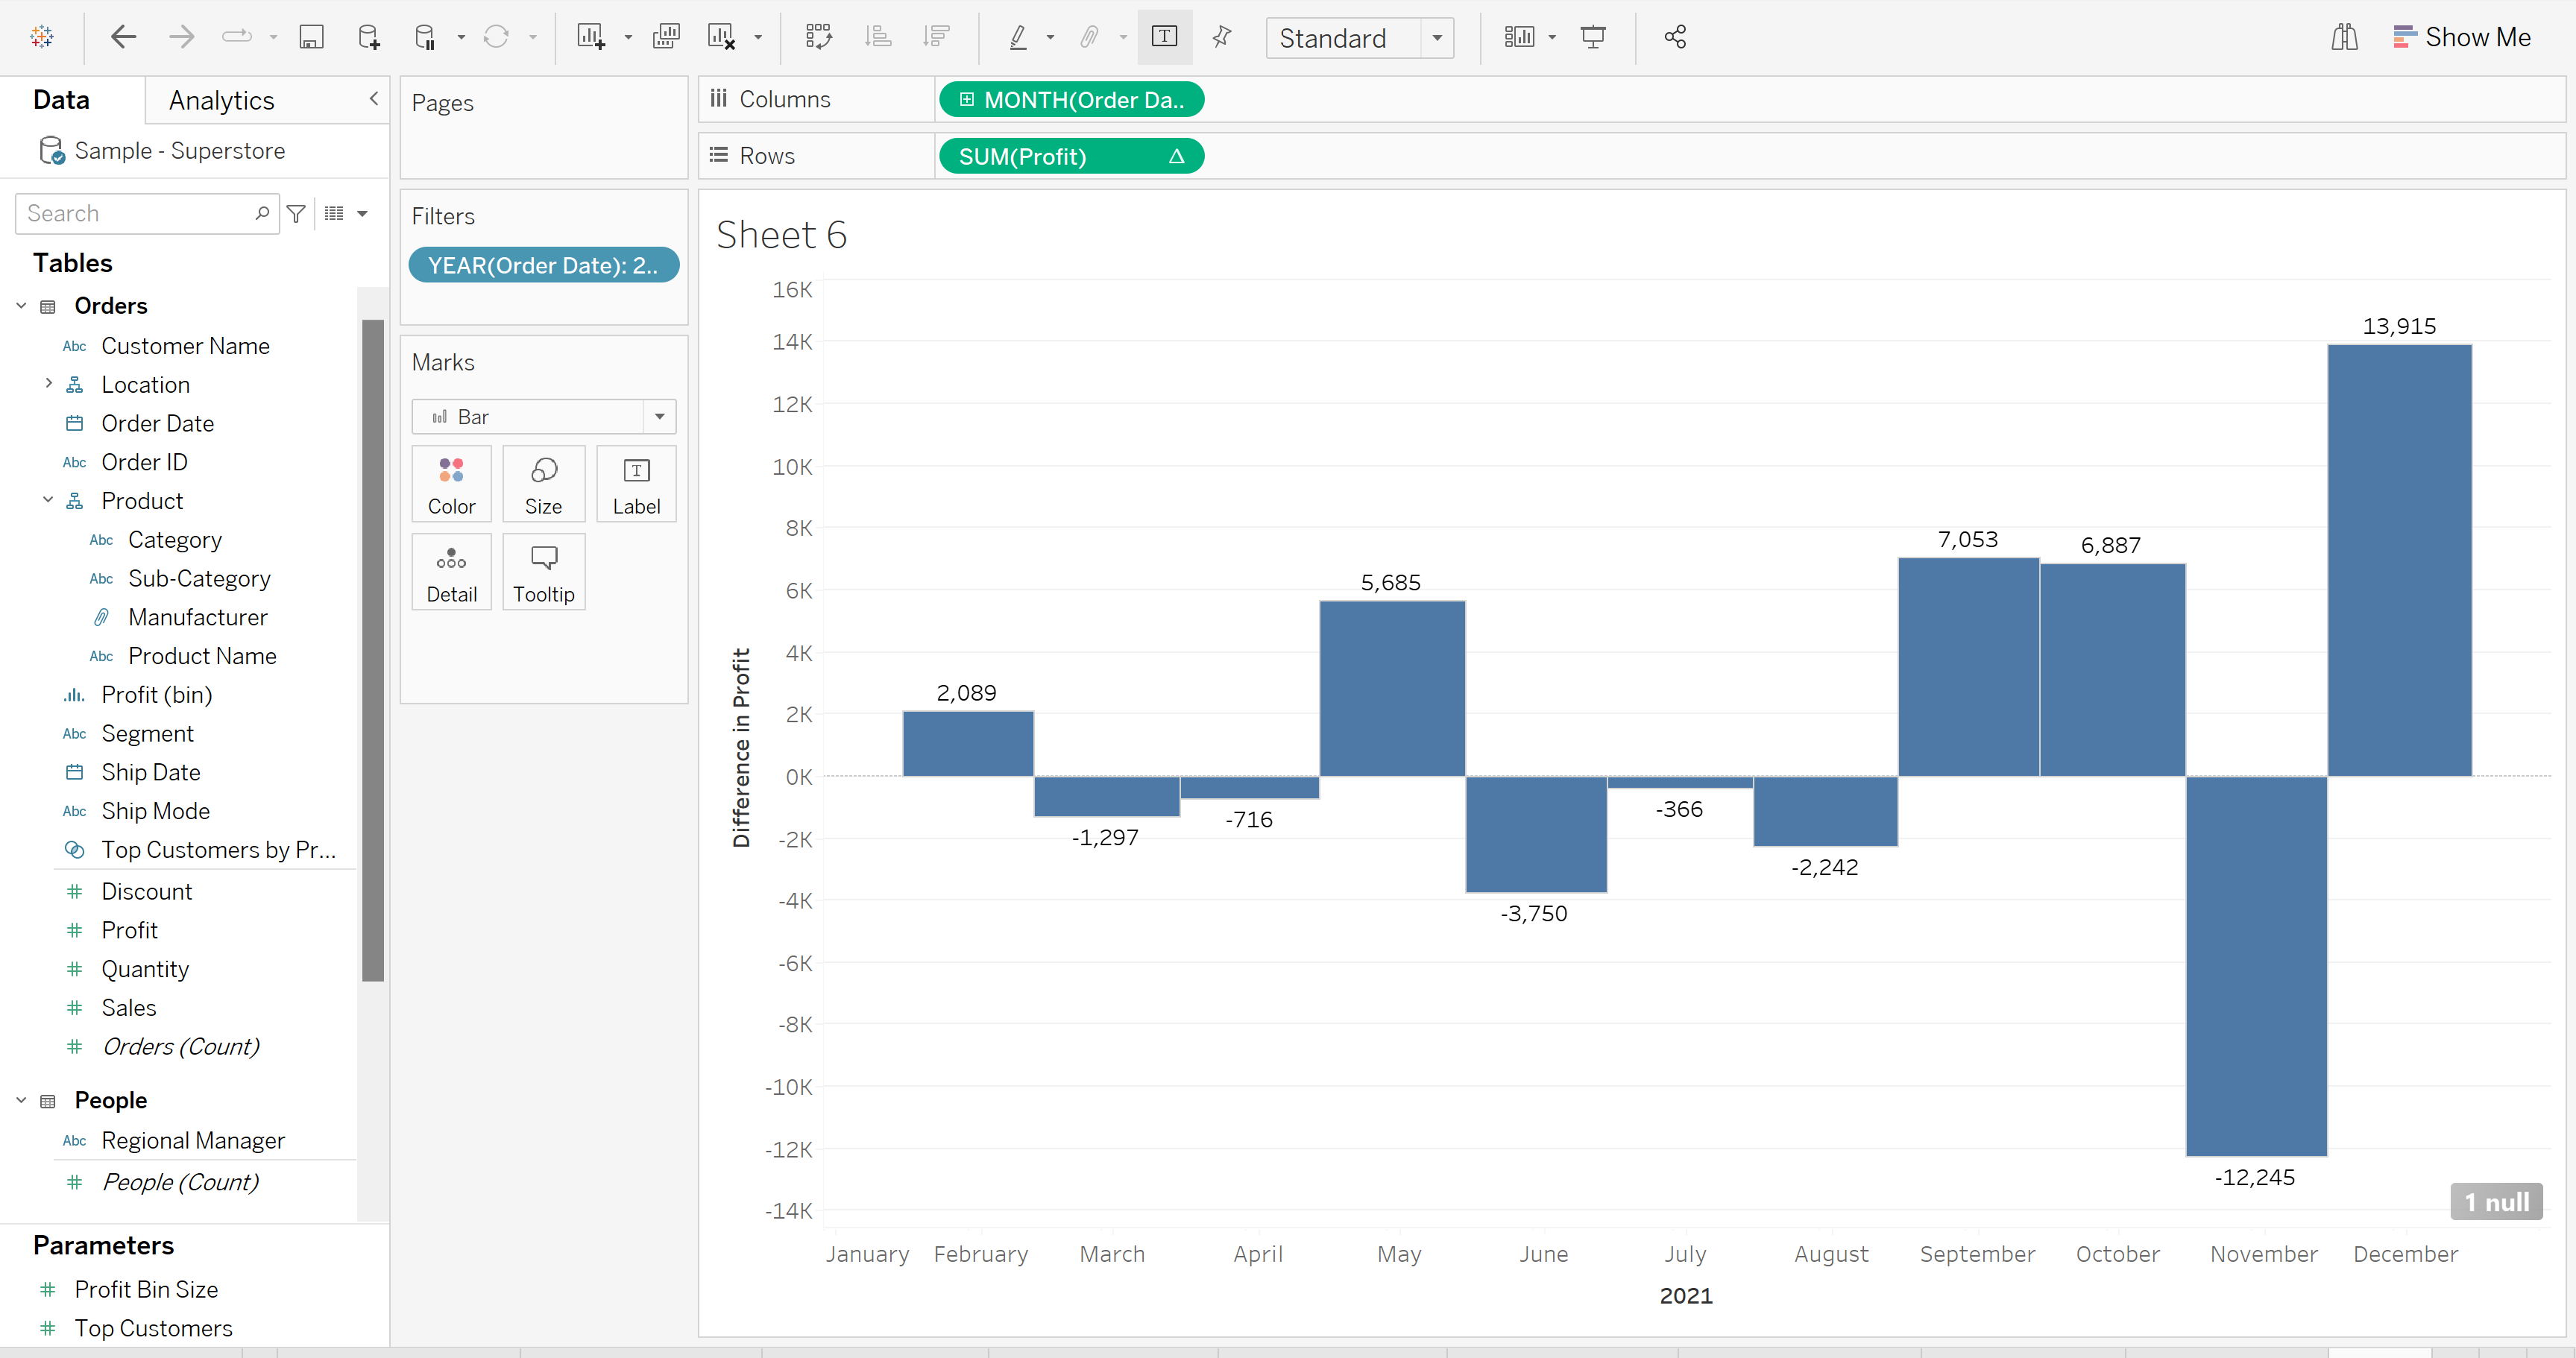
And that's it! You should be left with the following chart, which shows the monthly difference in the sum of profit, from the previous month, for the year 2021:
Difference - Advanced Table Calc
Tableau's default for Difference calculations is looking at the difference between the current value, and the previous value. However, there may be times where you don't want to calculate the difference using the previous value. Say, for the example we have been working with, we don't want to compare the sum of profit to the previous month in 2021, but to the first month of 2021 i.e. January. This requires a little more work than our quick table calculation above, and we can do this in two different ways.
Relative to:
Using the bar chart we have just created, we need to select the drop down menu on SUM(Profit), and select 'Relative to' :
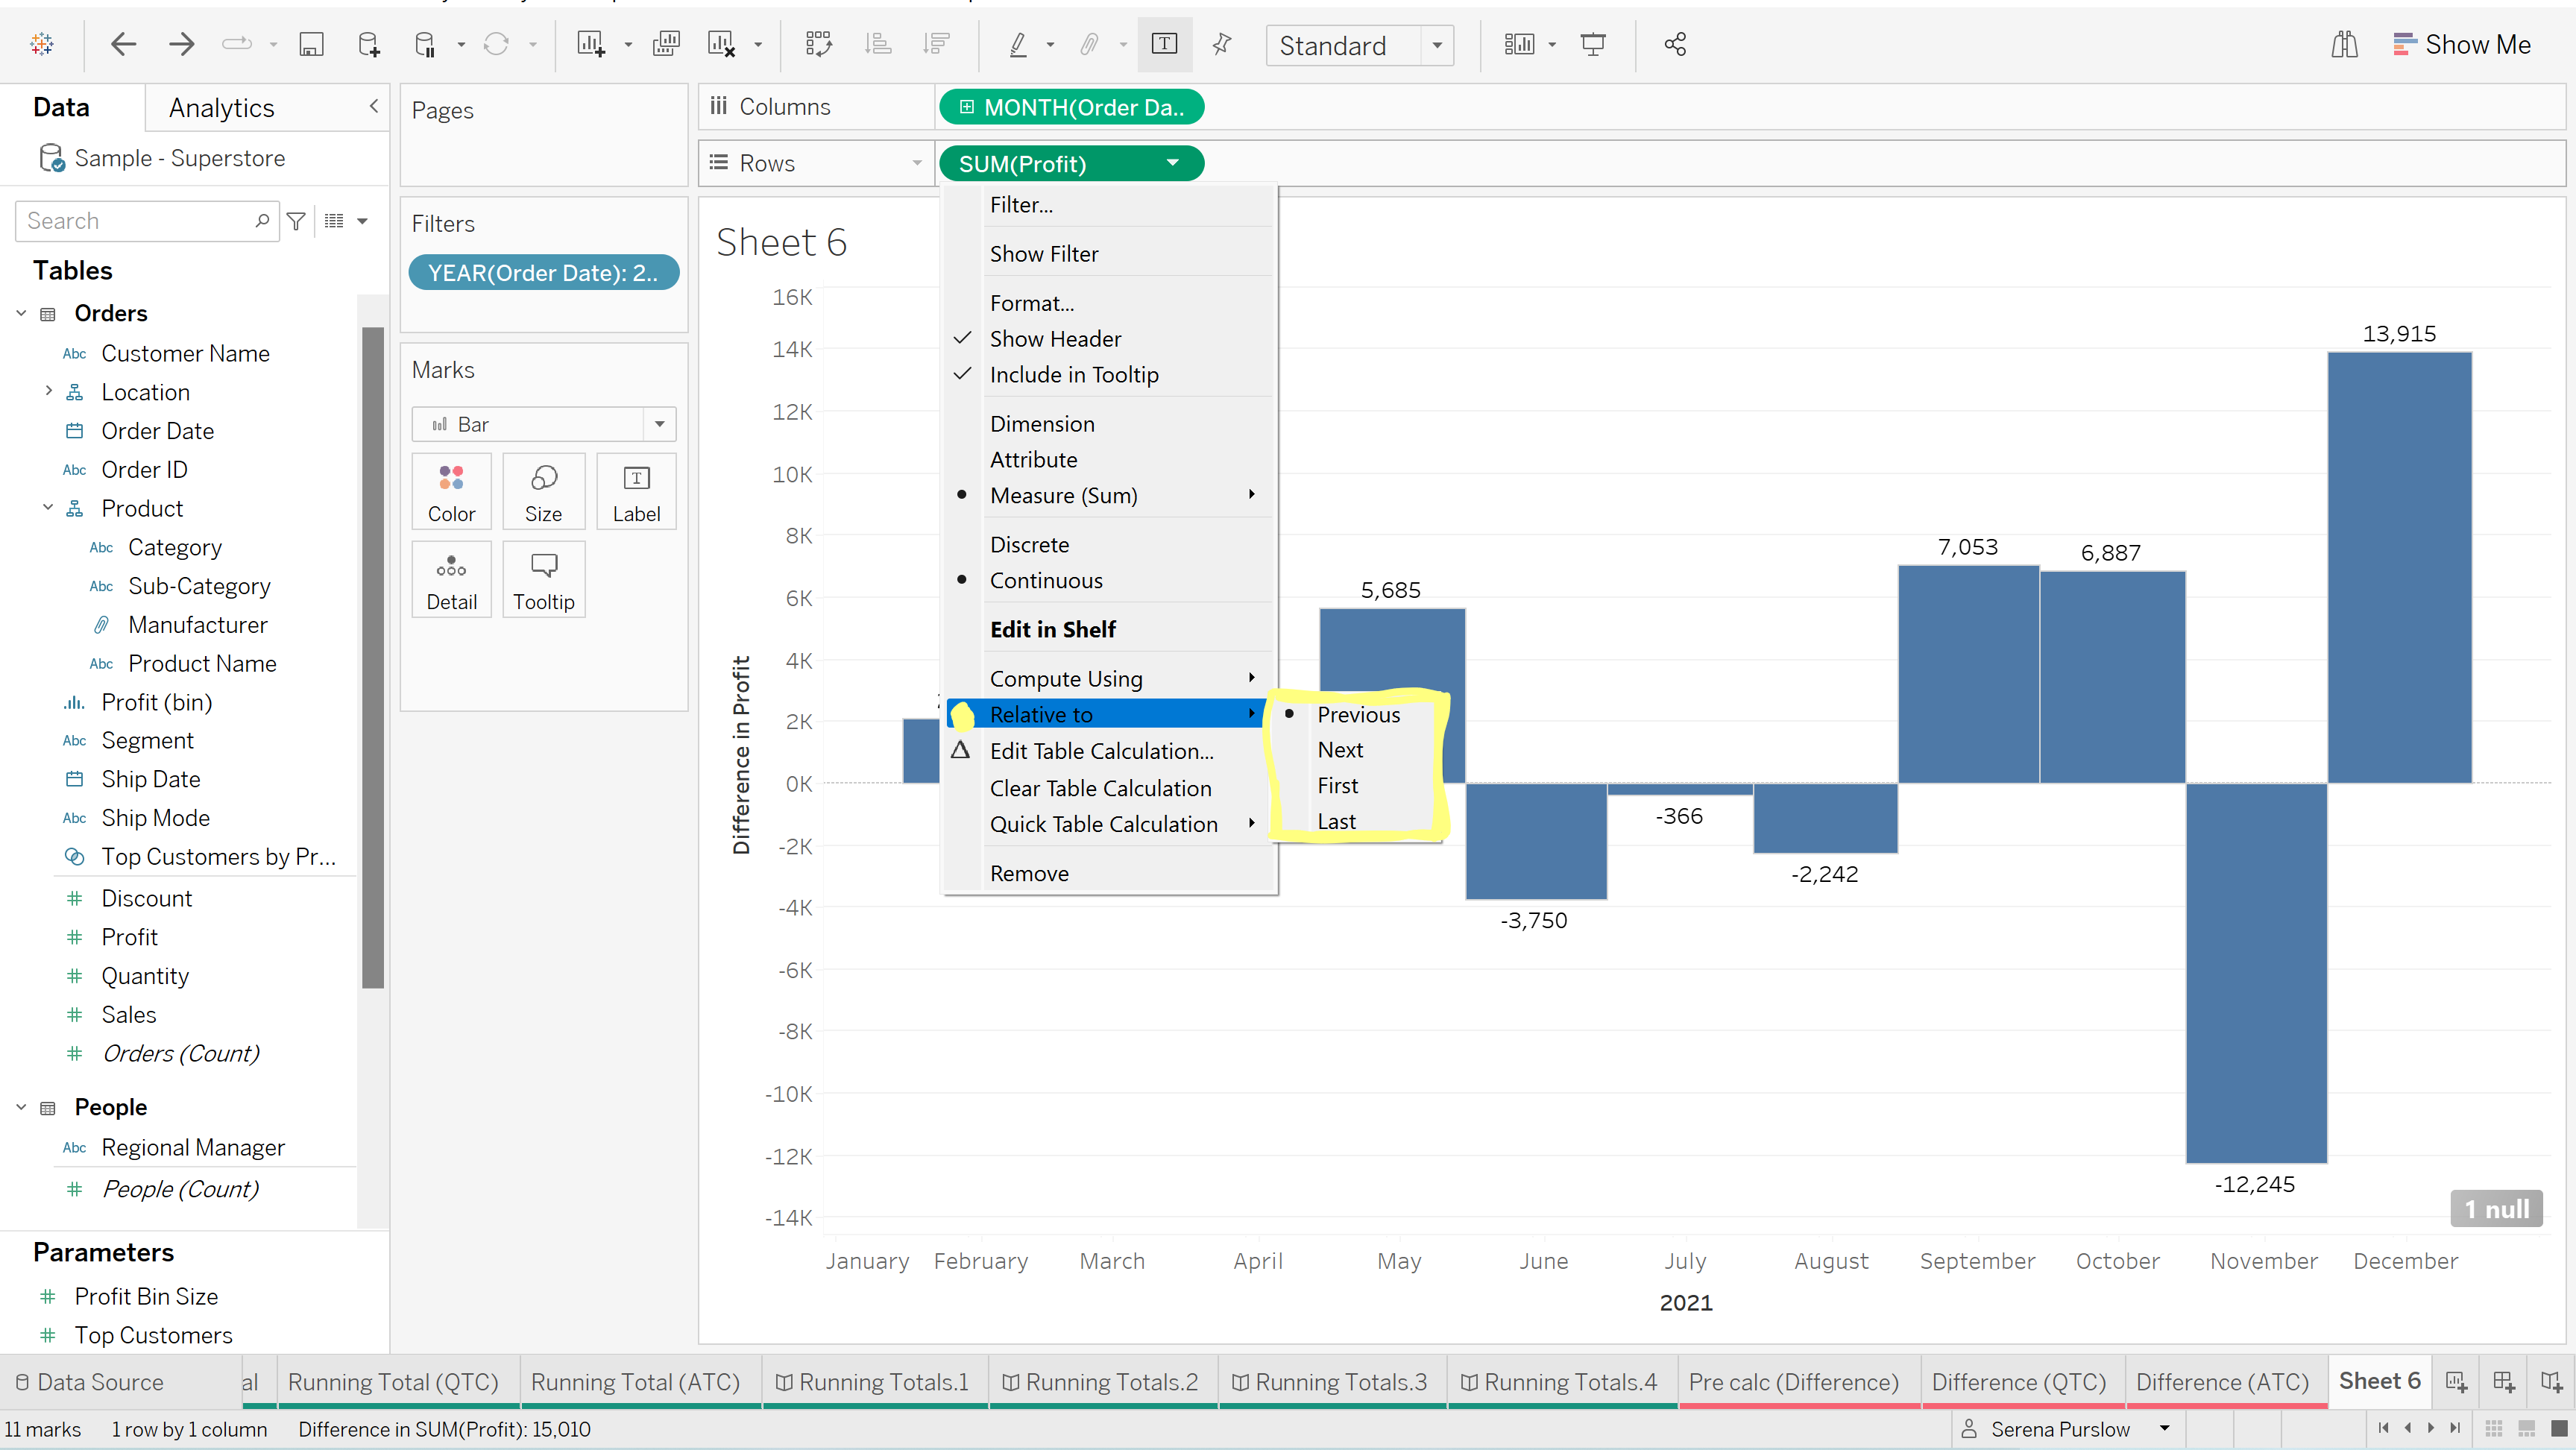
Here we are presented with four different options:
- Previous (i.e. the default) - Tableau calculates the difference between the current value and the previous value.
- Next - Tableau calculates the difference between our current value and the value after. E.g. for total profit in February 2021, we would see the difference between January 2021 and February 2021.
- First - Tableau calculates the difference between our current value and the first value.
- Last - Tableau calculates the difference between our current value and the last value.
As we want to compare the difference in total profit month by month, to the sum of profit in January 2021, we will choose 'First'. Our view should look as follows:
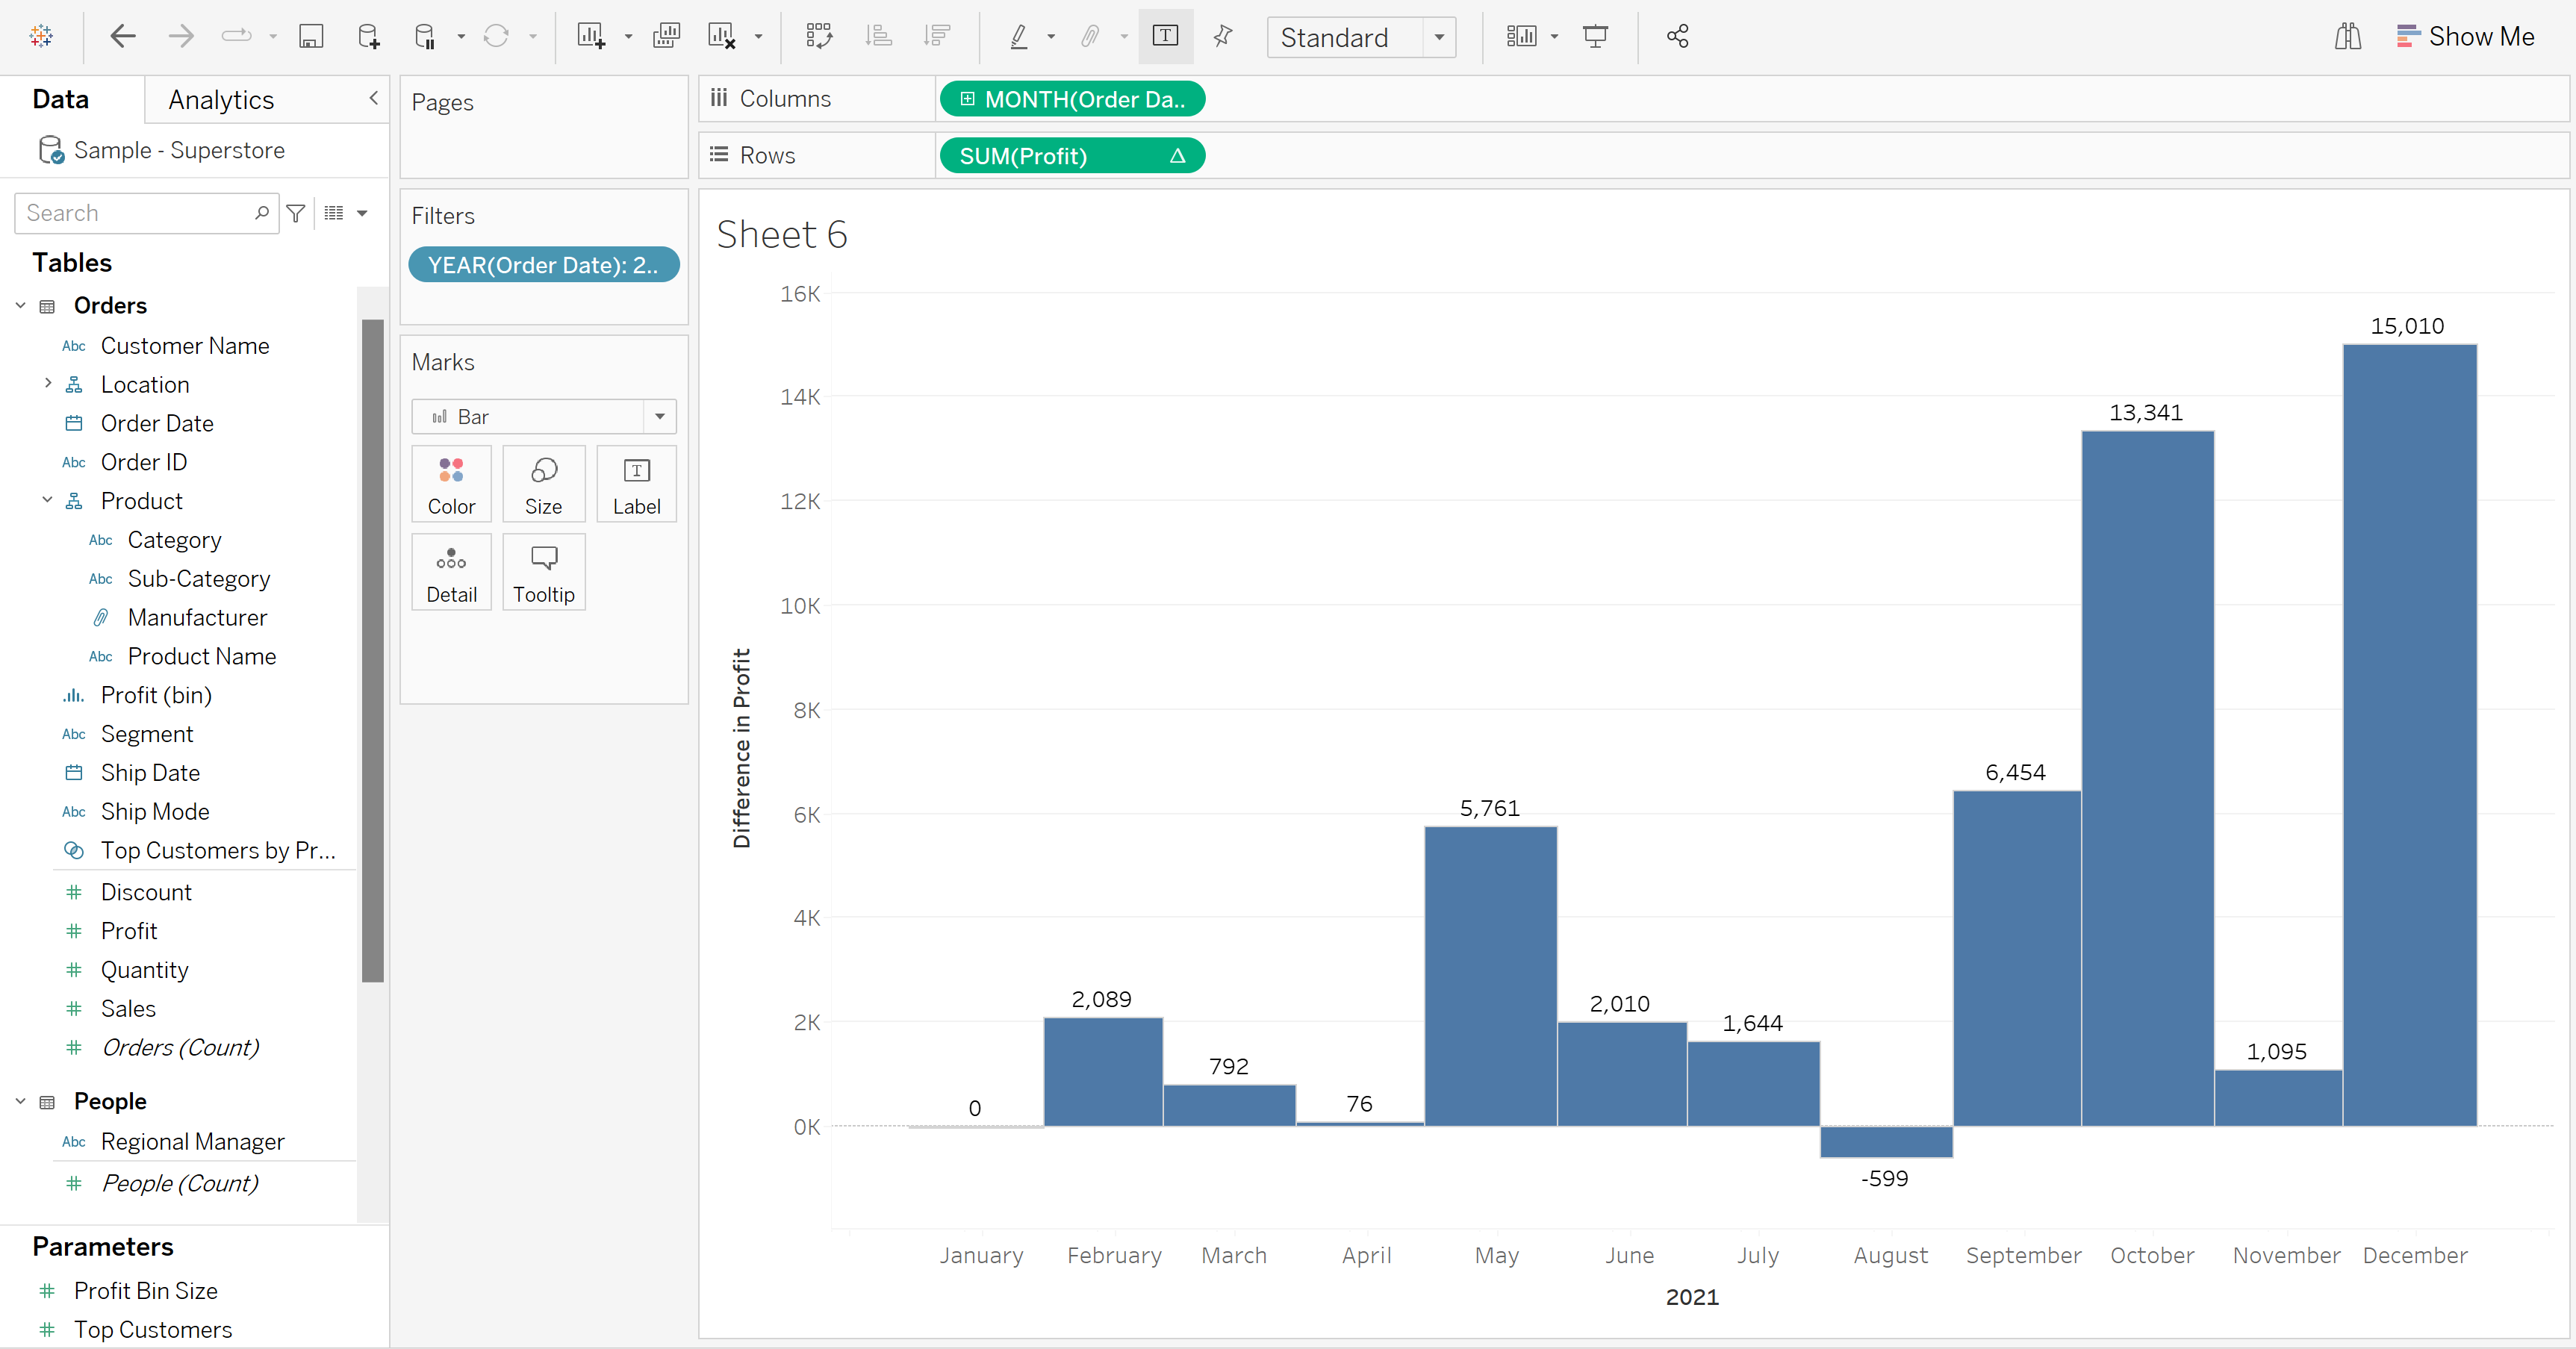
As you can see, for January there is a difference in profit of 0, as the sum of profit in January is being compared to itself.
Edit Quick Table Calculation
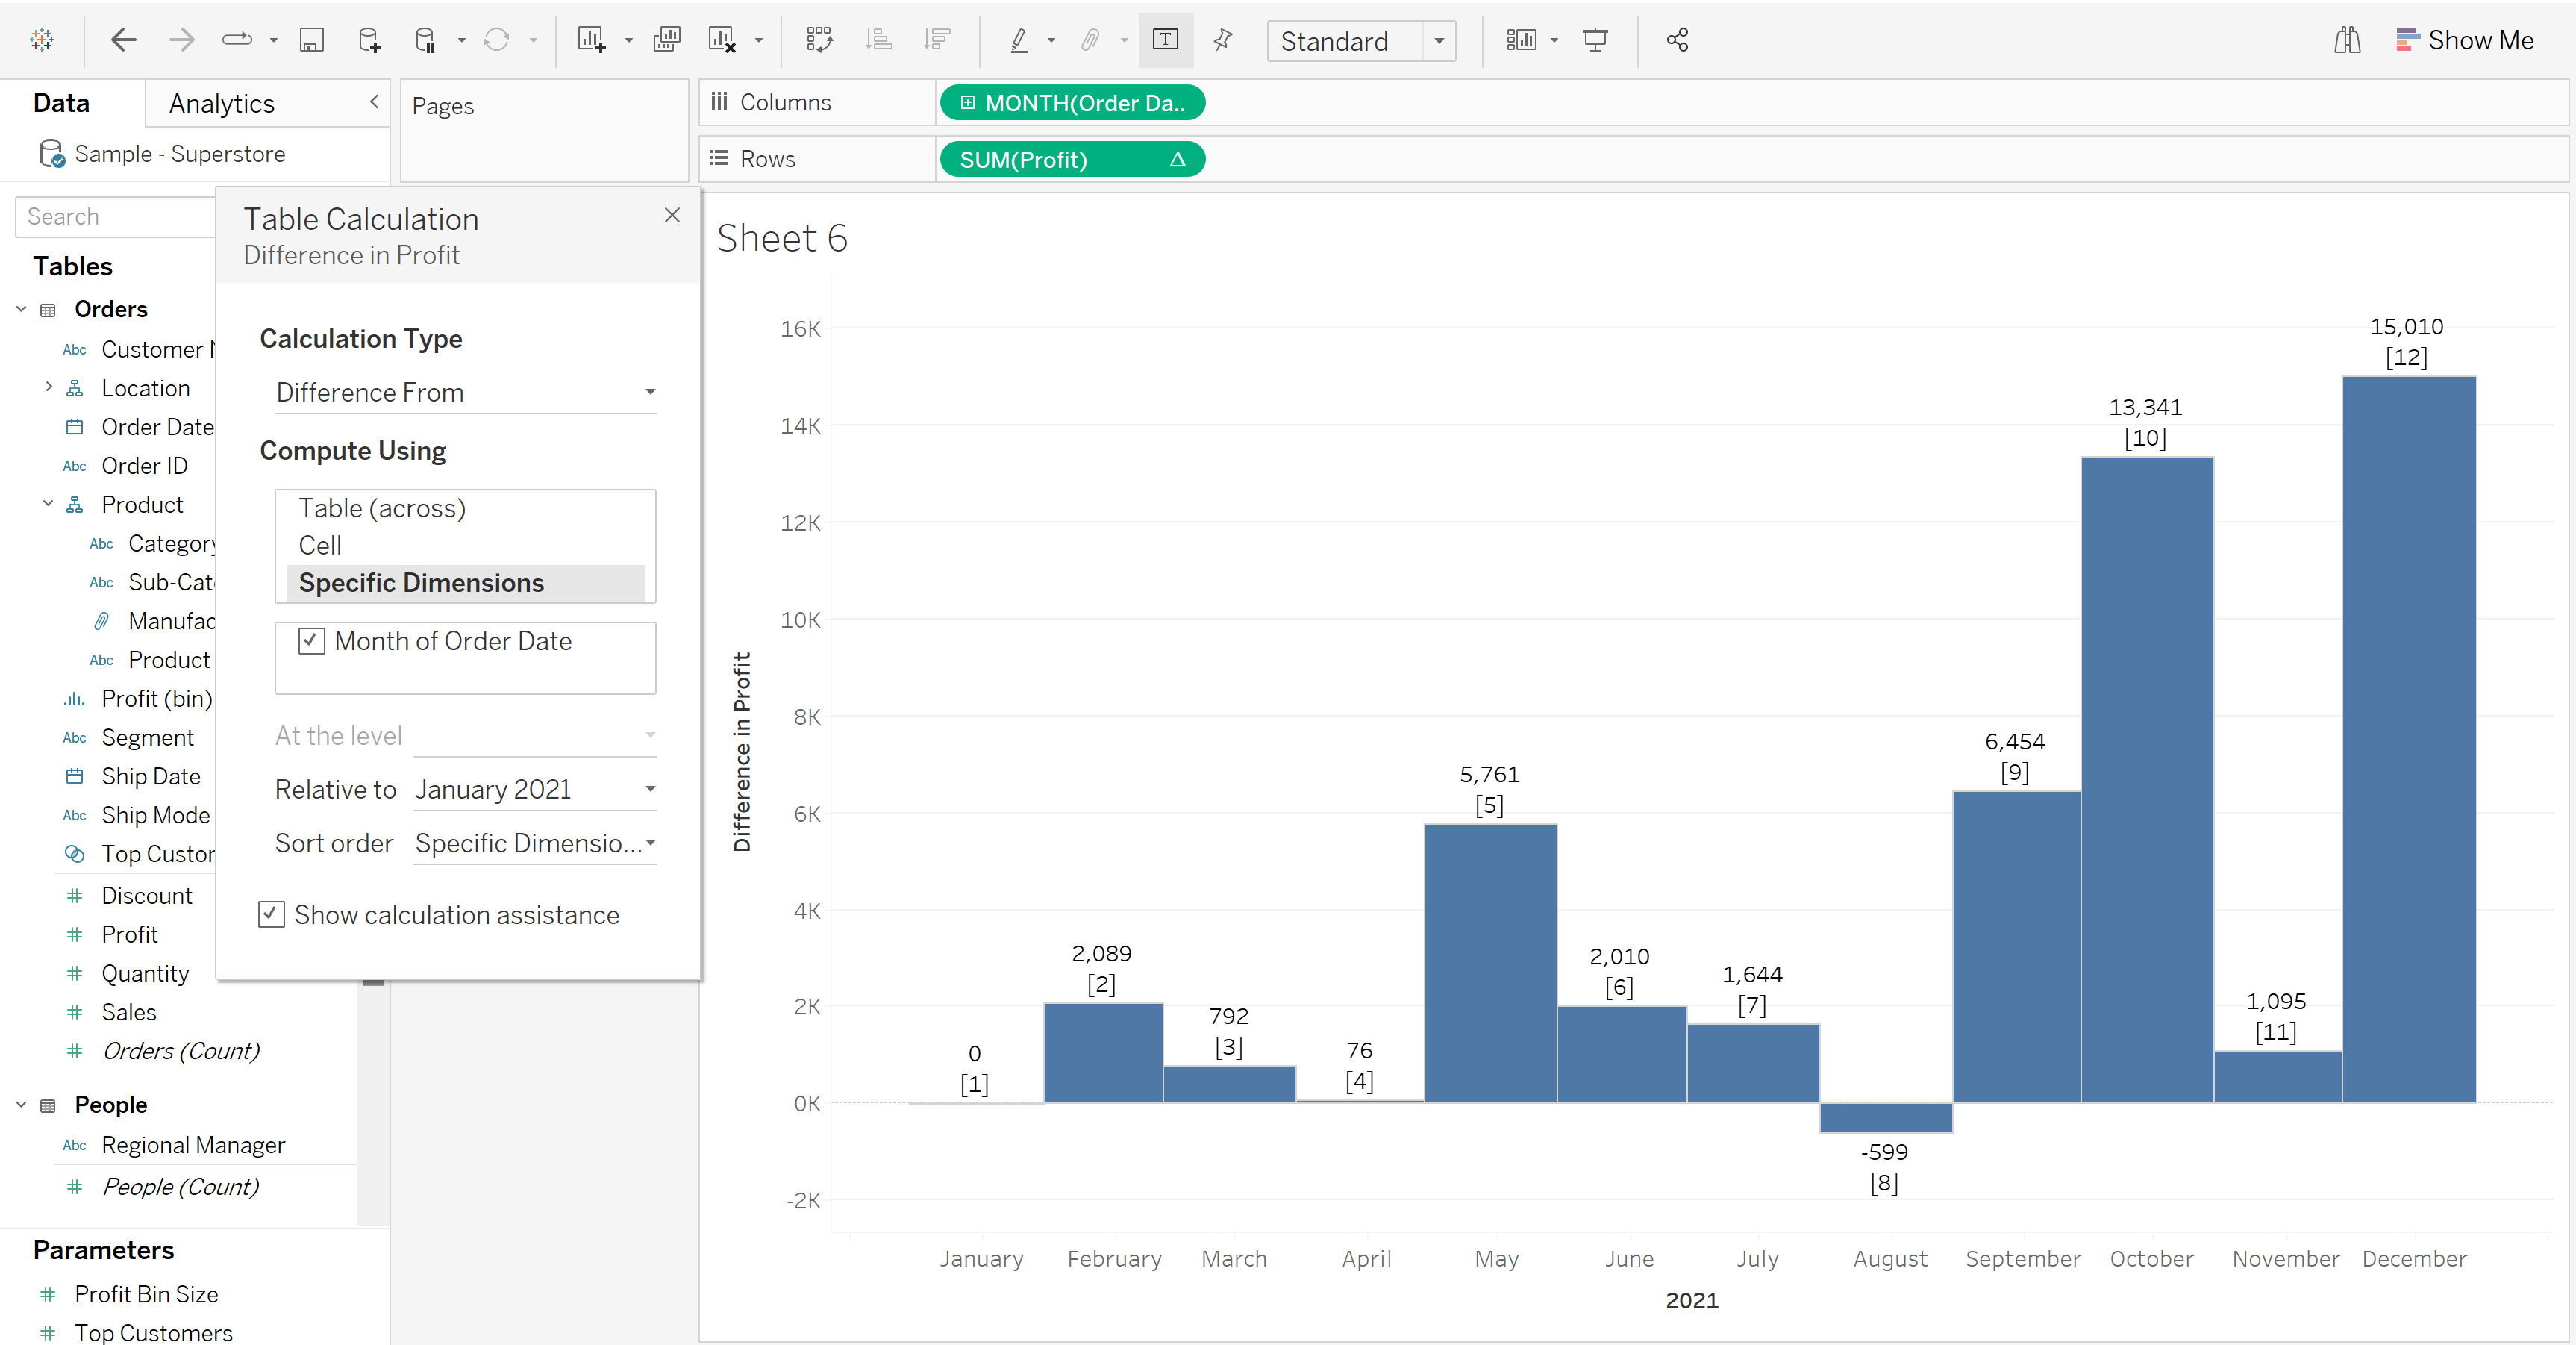
The second way we can change the value by which Tableau calculates our difference value from, is by editing our quick table calculation. To do this, select the drop down menu on SUM(Profit), and select 'Edit Quick Table Calculation'.
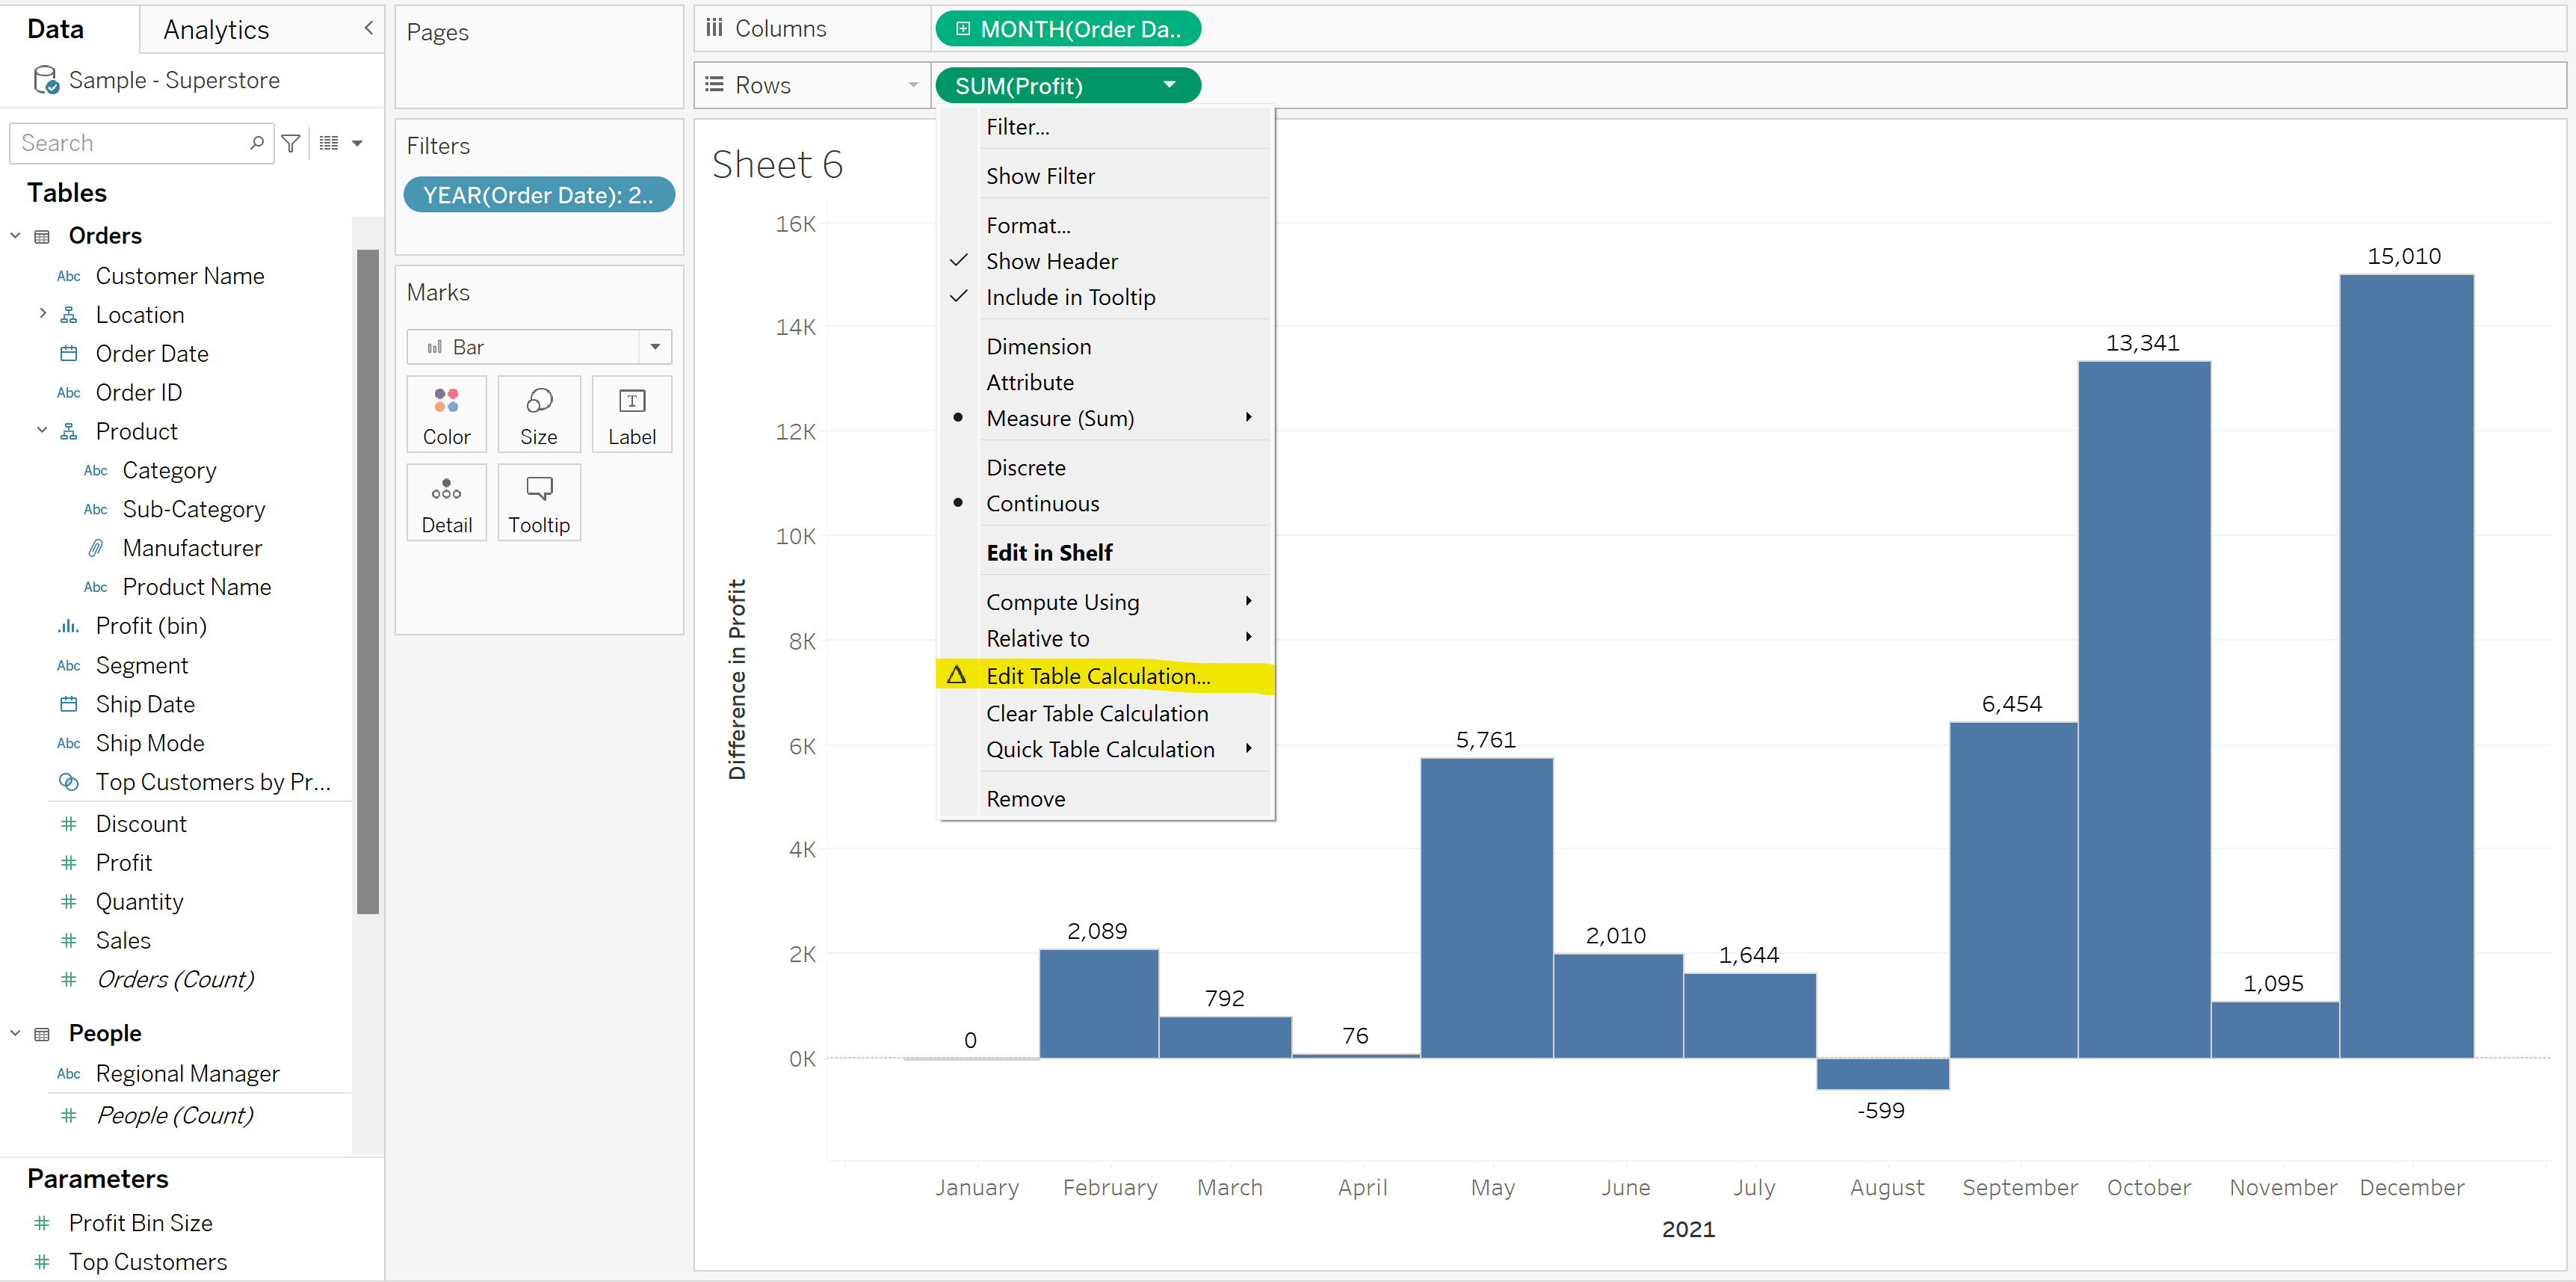
In the table that pops up, we want to select 'Compute Using' and 'Specific Dimensions'. As before, we have the option 'Relative to', which allows us to say which previous value Tableau should use to compute the difference in Profit. Again, as before we have the option to calculate the difference relative to 'Previous', 'Next', 'First' and 'Last'. Here, we also have the ability to choose specific months with which to calculate the difference, providing us with yet more control over the calculation.
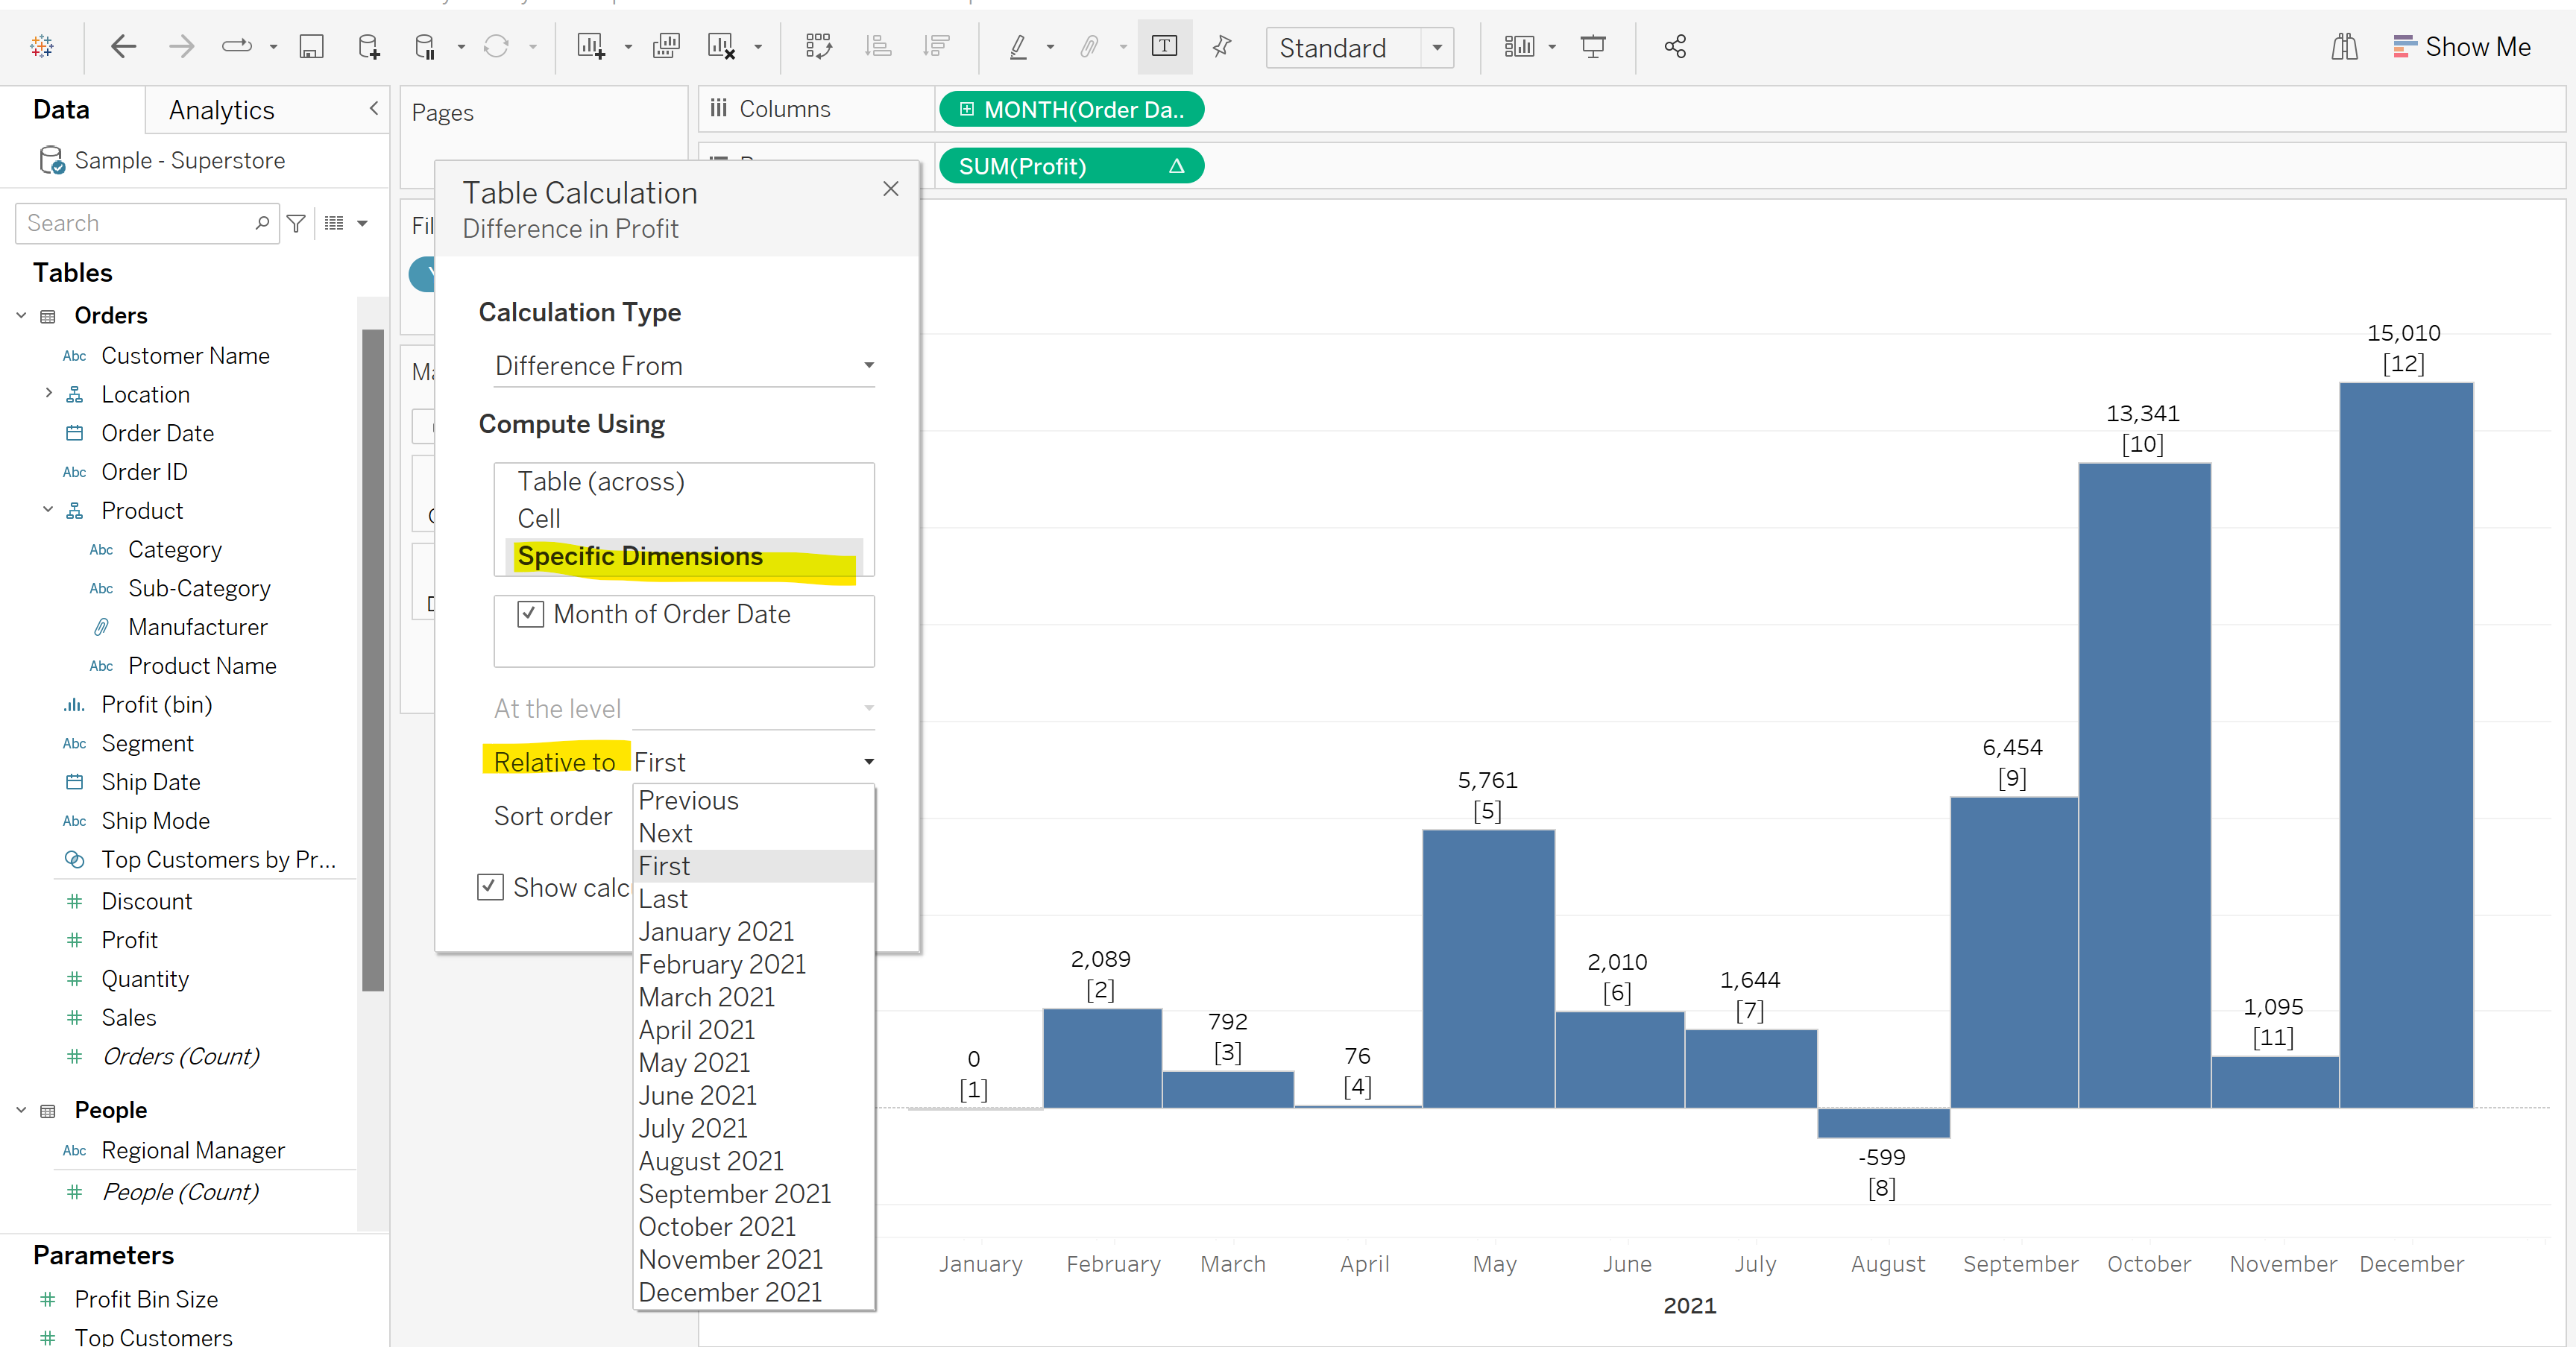
We wanted to calculate the difference from January 2021, so we can either choose relative to 'First', or we can select 'January 2021'.
And that's it! You should now be able to create a difference calculation using a quick table calc, and be able to change the value to which Tableau compares your current value to, creating your difference calculation.
Stay tuned for my next blog on table calculations, where I'll be going into 'Percent Difference'.
