This weeks' presentation challenge, was to take the Tableau Dashboards we had created for our applications, and re-build them based on feedback from the Interview, and what we have learnt over the past 2 weeks.
My original dashboard was on Shark attacks in Australia. You can check this out, along with my re-built dashboard, down below.
For me, re-building my dashboard meant:
- Adding supplementary data with population
- Changing my map to include said population
- Adding population to my line graph
- Removing text - the user should be able to see all take-home key points, without reading masses of text
- Using more white space to make the viz more appealing.
- Using containers as opposed to Tiled boxes to keep my viz looking the same
To do this, I had to join my original data set to a new data set with population data in it. It should be noted that I did NOT do this correctly, so some of the population data on my new Viz in incorrect. Lesson to learn: Make sure you know HOW you're joining your datasets.
Anyway, despite this hiccup, visually, my second Viz is a huge improvement. Check them out below.
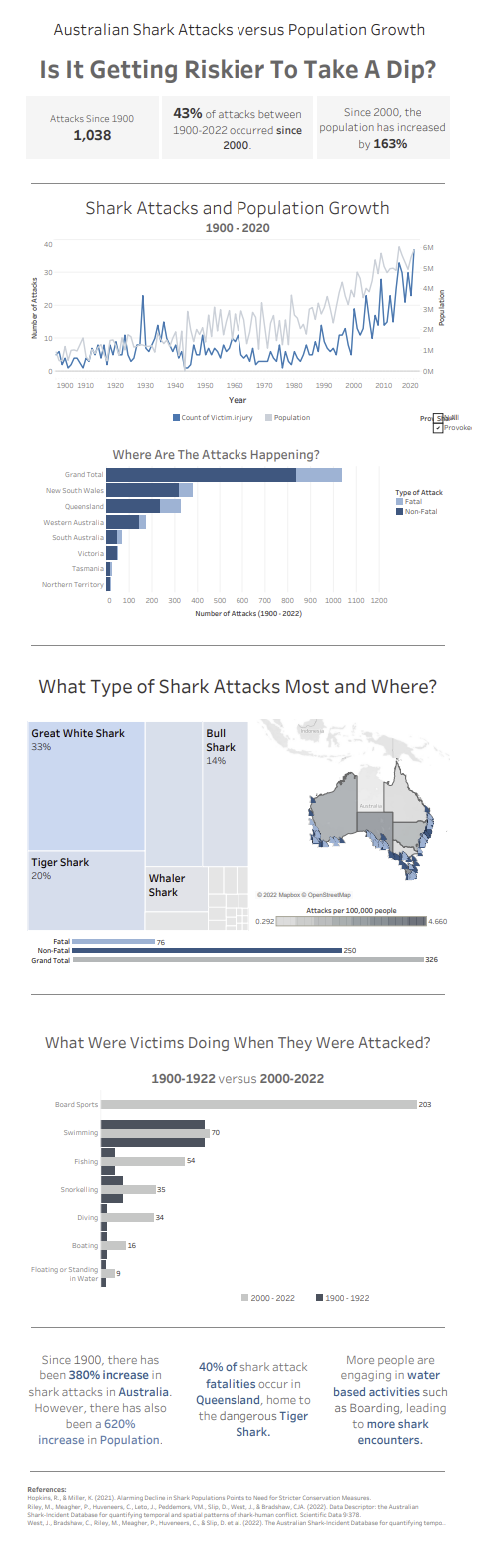
My Application Viz:
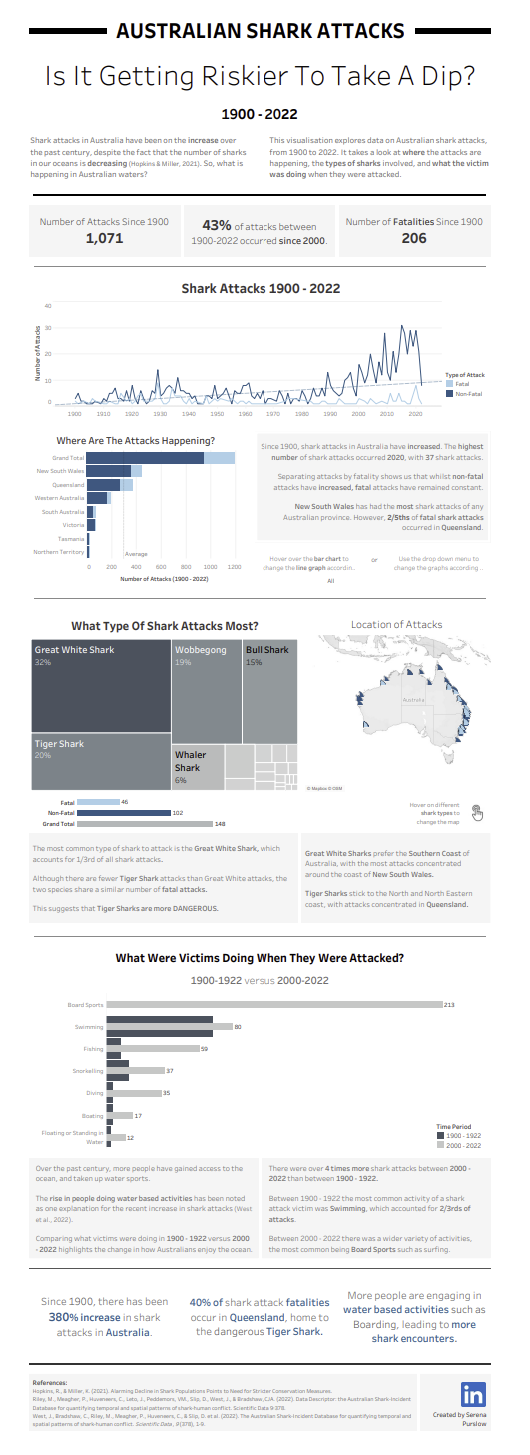
My Re-Built Viz