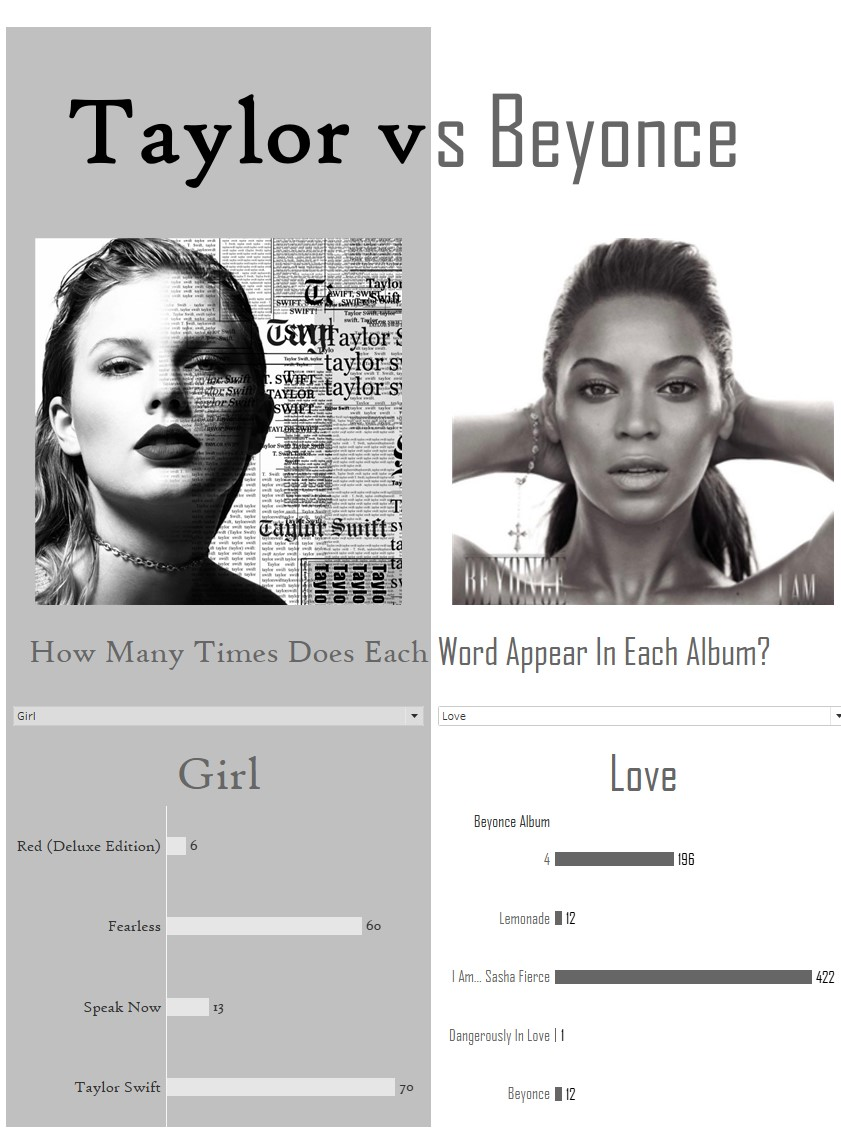
Our dataset(s) for this week included a zip file of 21 csv's of different singers (https://www.kaggle.com/datasets/deepshah16/song-lyrics-dataset). Since I had been considering building a dashboard comparing the success of Taylor Swift and Beyonce, I joined the Taylor and Beyonce datasets included in the zip file. I data prepped and joined the 2 data sets in Alteryx.

Once in Tableau, I used the CONTAINS function to identify how frequently popular words appeared in their song lyrics. Though I intended to count ~10 words, I scoped down and only for 4 words: love, heart, boy, and girl. My plan was to use a parameter to compare count of each word between both artists. Since CONTAINS only identified a single word, it resulted in each word having their own field/column, which then led me to using a sheet swap vs. a traditional parameter and calculation. This also meant that each artist had their own parameter, which was less than ideal. Despite this, I was happy with the aesthetic of my dashboard.

I plan to go to back to this dashboard, and add more information, and will probably pivot the count of words (i.e., girl, boy, etc) in Alteryx so that I can rely on fewer parameters and sheets for my dashboard.
