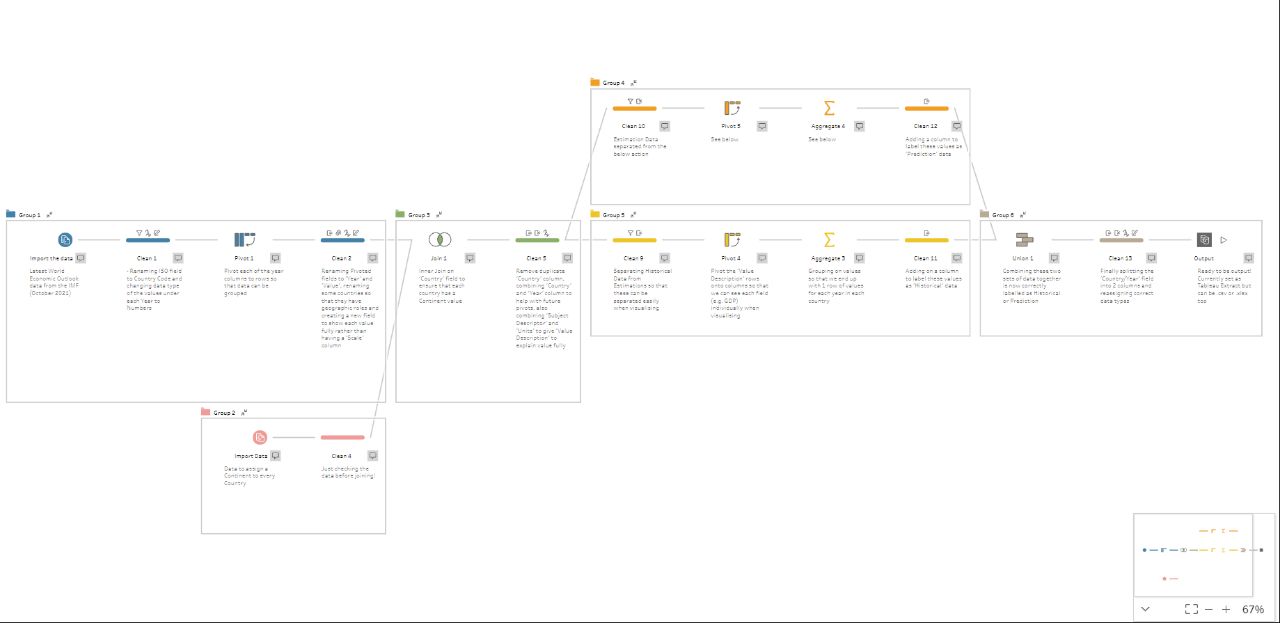
Our project for this week was to create a workflow in Tableau Prep which could be used by the public to analyse some data should they be interested in doing so. The idea for my workflow was to enable anyone who is interested in finding out financial information of countries/continents around the world to do so - for example, this could be particularly useful for a business-owner who is looking at expanding overseas.
My flow contains two datasets:
o The most recent World Economic Outlook data from October 2021 which comes from the International Monetary Fund.
o A simple excel document to assign a Continent to each Country in the world; mine was found on GitHub but there are many available.
I want to combine these two as the data from the IMF is useful, however combining the Continent data allows a different level of granularity when considering different locations and may be of interest for people looking at a wider area of the world as opposed to one specific country. Also, the format of the data after downloading does not allow for much trend analysis. The prep flow for allowing this can be seen below:

The output from this flow will allow the user to have a look at any of the 196 countries within the dataset and visualise a range of financial figures such as GDP, Inflation and Unemployment. Previously the data was not in a useful format to be visualized as every year was an individual column with a single value in it. This was good for being able to visualise one year's figures at a time, however pivoting the data in the workflow also allows for analysis of trends over time which can be useful when making decisions for the future.
The World Economic Outlook releases an update every 6 months - which the formatting appears to be consistent for - so once an updated version has been released (next one will be April 2022) this can easily be swapped in place of the original input to ensure the data is as up-to-date as possible.
A range of different vizzes can be made from the data this flow outputs, here is an example of one I made which allows the user to be able to look at global, continental or national level figures as such:
o The Map allows users to glance at and see how different countries compare, with rankings also included in the Tooltip.
o The Line charts give a quick overview of the Inflation, Unemployment and GDP trends over time for the selected area of the world.
o The Scatterplot allows users to choose two metrics and see each country's figures for these, whilst also getting an understanding of any correlation that may exist.

To reiterate, this is just a concept of how the Output data could be visualised as there are many different values from the IMF data that could be analysed, but for the sake of this project I thought this viz would encompass a broad range of metrics to showcase this.
