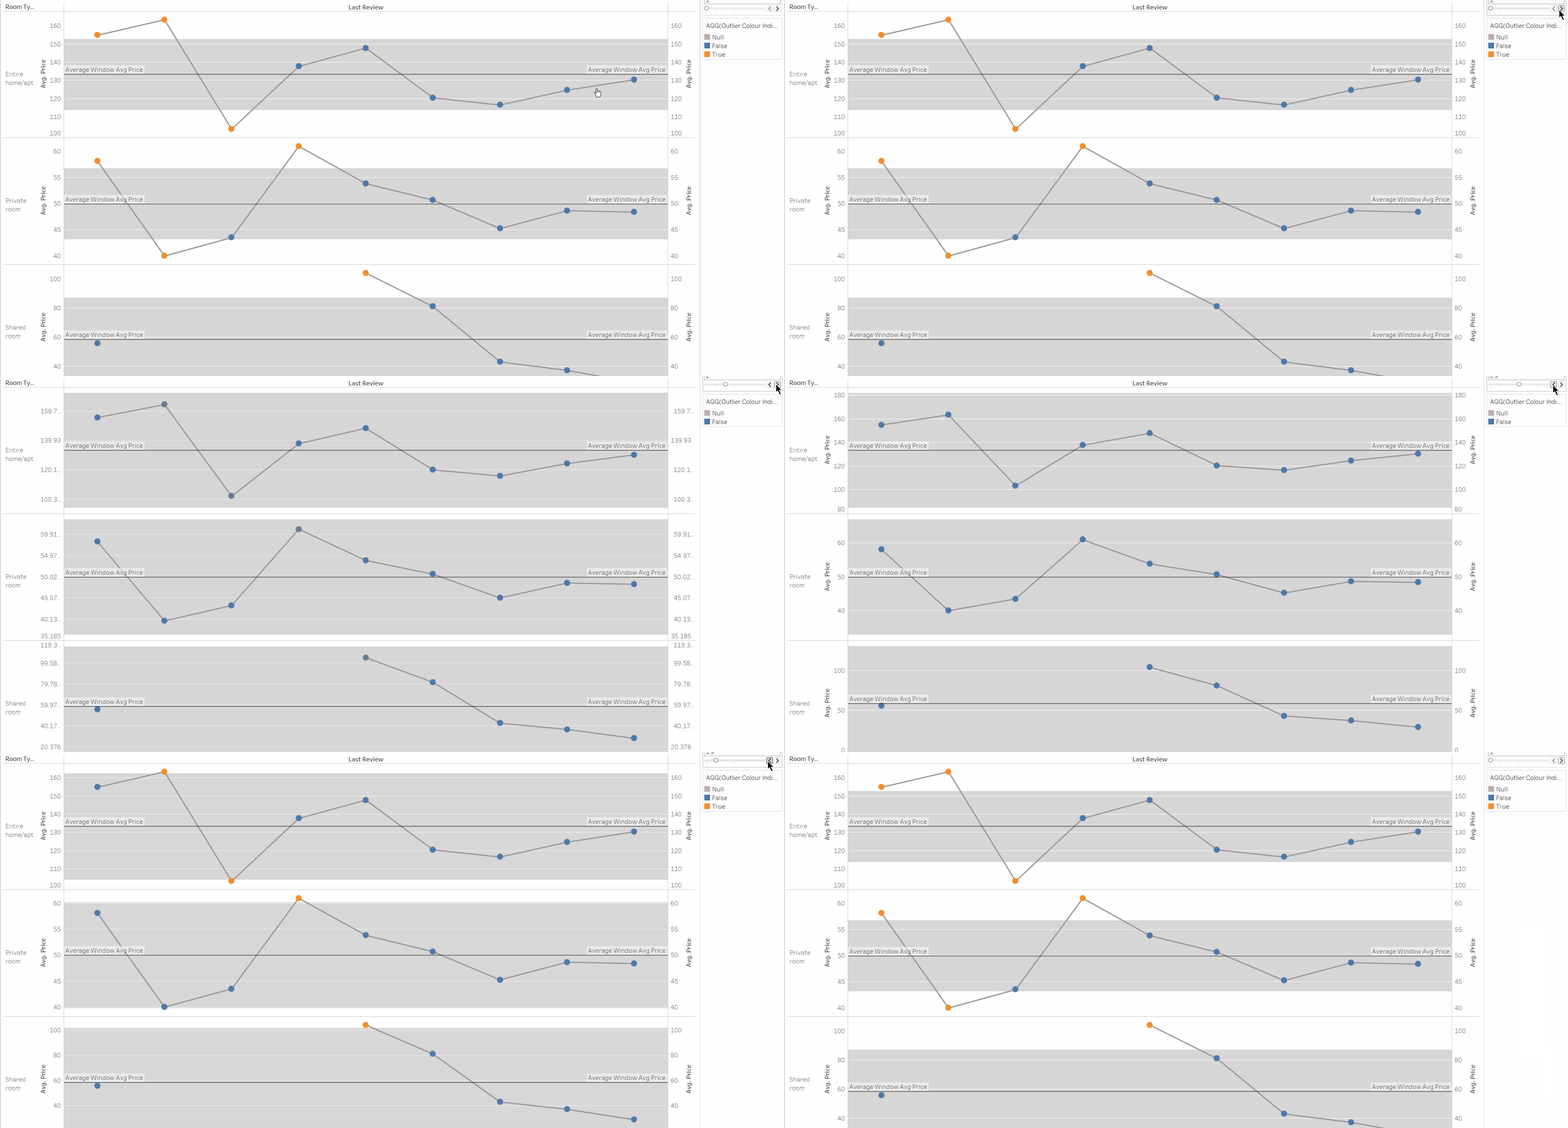
When comparing trends it is common to use a Reference Band in order to give a wider analysis of this - particularly when trying to find outliers within a dataset. The default is for Tableau to look at a Minimum and Maximum value for whatever value is being shown on your worksheet, which looks something like below when looking at AVG(Price):

Which isn't too helpful...
Instead, it would be more useful if we could control this band to change depending on our analysis, so in this instance I'd like to control this by the number of Standard Deviations from the mean. Firstly I created a parameter which starts at 1 and goes up in increments of 0.5, allowing the user to control how many standard deviations to see at any time.
After this, I created calculated fields for the lower and upper bounds of the reference band as below (the only difference being the minus would become a plus for the upper bound).

After this, all that was needed to do was to drag in the Reference Band from the Analytics pane, and then set the lower and upper boundaries using these new fields as so (the Minimum and Maximum options don't actually make any difference as the fields have already been calculated!):

And after putting in some final colouring to show whether a specific mark was an outlier based on the value currently in the parameter, the below is formed!

