


Today's project was to have a look into the Tableau Server data for TIL and find a certain aspect of the Server to analyse and visualise. For mine, I've had a look at the data recorded on workbook creation and to see if there are any time trends associated with this. You can see a snapshot of my dashboard below and I'll go through this in steps.
Part 1 - Header, BANs and Snapshot Bar Chart
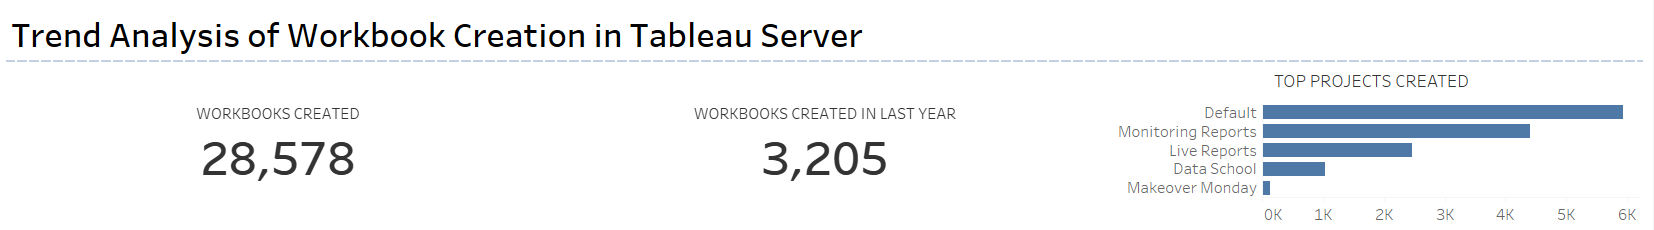
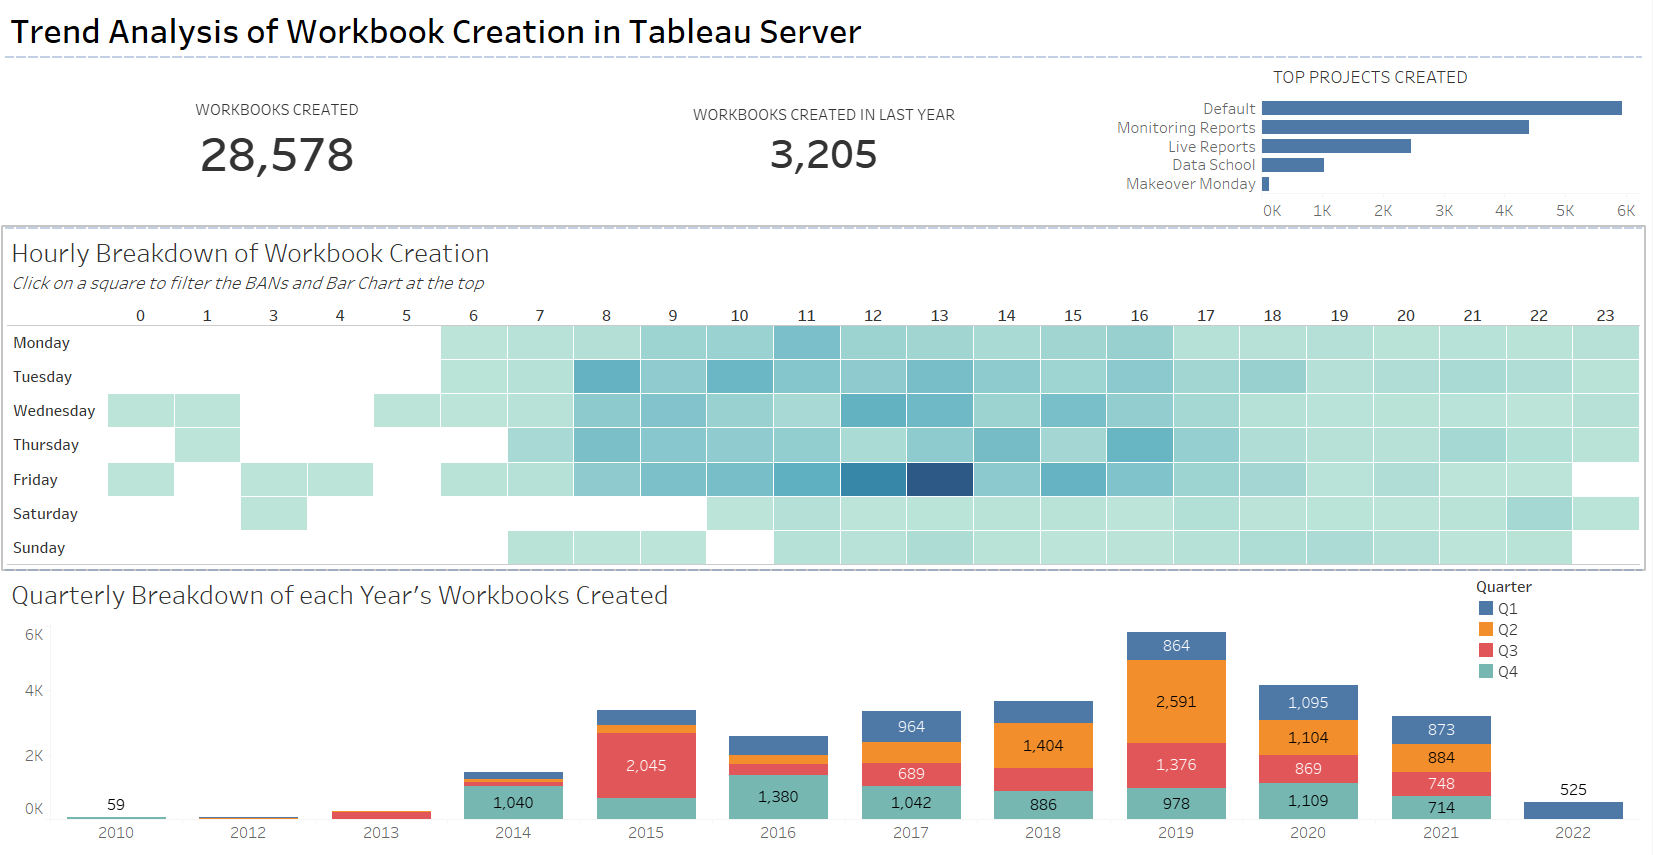
When looking at this data, there weren't many questions that I could think of which were answered with anything other than a null hypothesis - which is fine - but I thought that an overall view of the data made more sense as a title than one specific question; hence the title.
The BANS are fairly self-explanatory too, but I thought it would be interesting to give some context of the Server and how much it has been used since 2010, and then also to have a look at how much of that has been in the last 365 days. Lastly, the bar chart provides a snapshot of some of the most commonly created workbooks - perhaps unsurprisingly 'Default' leads the way!
Part 2 - Heatmap

For the next part of the dashboard, I wanted to have a look at the hourly breakdown of each week and see if there was a particular time where workbooks are created more frequently. As you can see from the screenshot, lots more workbooks are created at 12pm and 1pm on Fridays! At first I thought this may be down to frantic preparation for Friday Projects by Data Schoolers, but that obviously wasn't the case as everyone is always very prepared ahead of time 😊 It turns out that a large amount of workbooks are created for Live and Monitoring Reports at those times which accounts for this (this is shown in the Bar Chart at the top of the screen which updates to show the breakdown).
I also thought it was interesting seeing some workbooks being created in the early hours of the morning - but this was explained by DS New York operating at these times.
Part 3 - Bar Chart for Annual/Quarterly Analysis

Lastly, I wanted to have a quick look at how each year compares and to also have a glance at how particular quarters compared with each other i.e. was there a busier time of year for workbook creation. The short answer to this question was no - or not obviously - but 2019 was a particularly busy year for workbook creation on the Server.
Overall, this exercise provided a good insight into some of the behind-the-scenes data that is stored on the Server, accessing this and the kind of analysis that can be performed on our own activity.