Following a morning session on Accessibility when creating visualisations, we were handed a dataset looking at Obstructions in and around Glasgow which split these into two categories; potholes and pavement/footpath obstructions. The idea was to create a viz which would be useful to a user whilst also incorporating many of the new accessibility aspects we'd been taught that morning into this. I also had an external call during this, so essentially my task was to try and get this done in 3 hours which was... challenging.
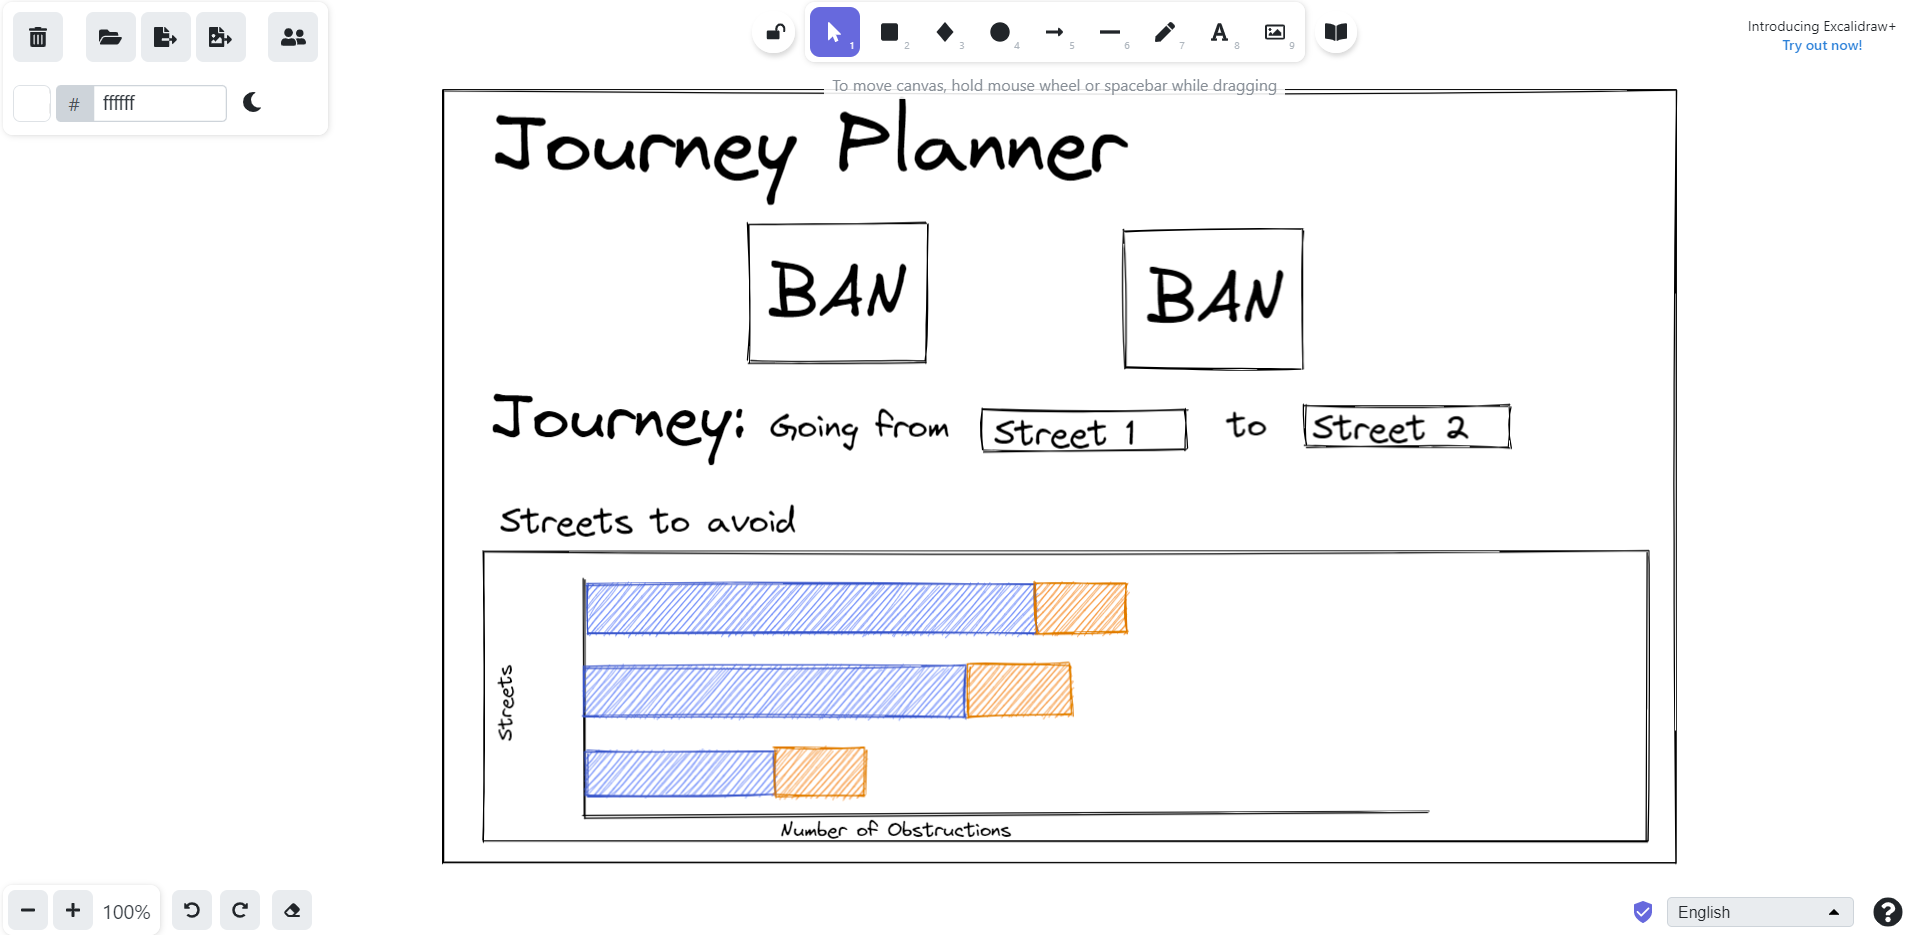
My first task was to have an initial look at the data itself to find out what I would visualise. The data itself was interesting and made sense to me quickly (which was good) but the idea I'd sketched out ended up being quite tough to do, particularly in the space of 2 or 3 hours (which was bad). I've put a sketch of this below but essentially the idea was that the user would be able to choose two different streets in the dataset and find out how to avoid obstructions en route.

As we had been instructed the day before; if we were going to fail, it's a useful skill to learn to fail quickly. With this in mind, I abandoned my original idea after a little while of trying to work out how to do it, and moved onto something more simple but that would incorporate many of the points made in our morning's lesson.
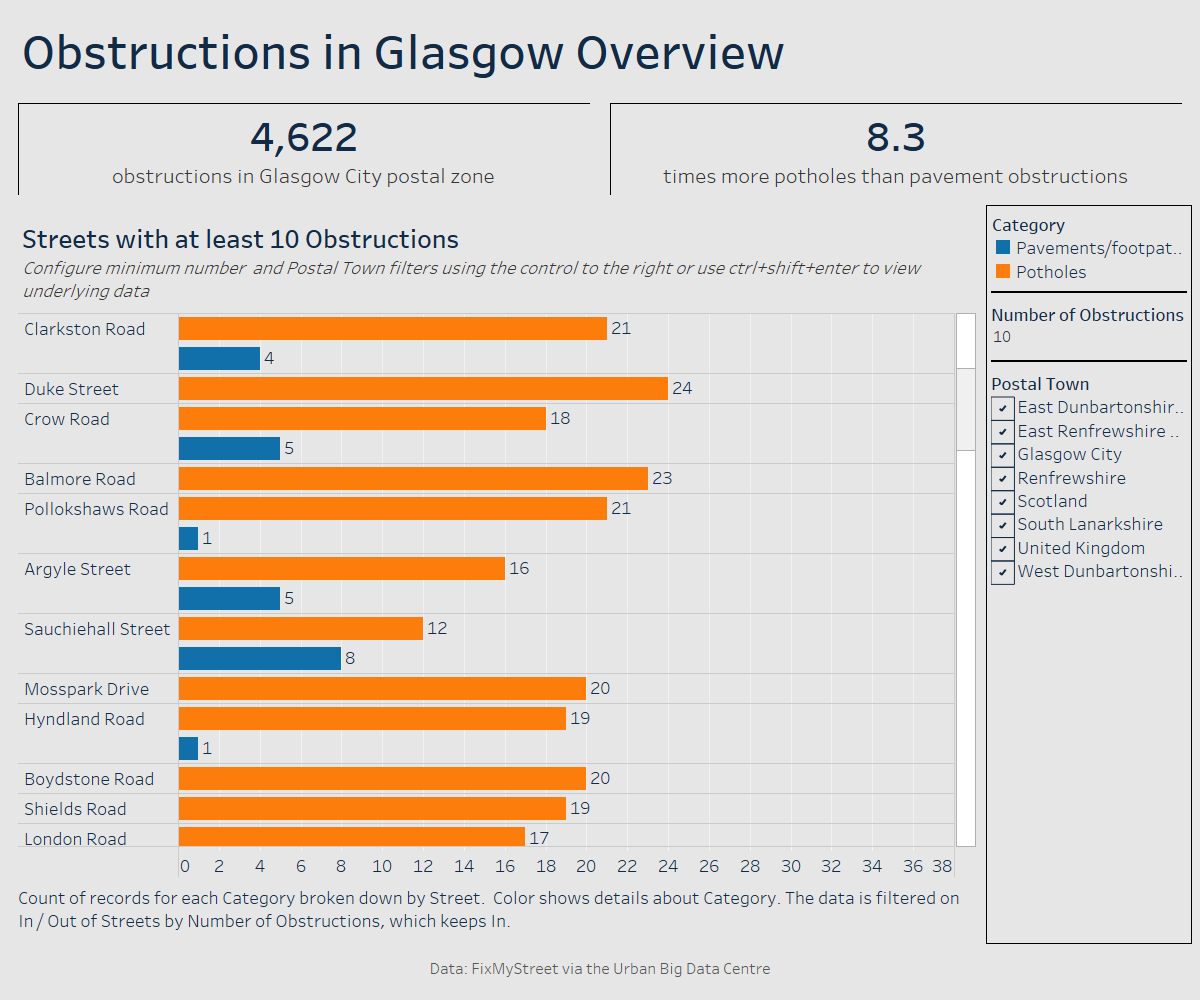
My new dashboard was essentially a simplified version of the previous concept which allowed for users to see streets which had a certain amount of obstructions, with some interactivity allowed to decide how many obstructions would be set as a minimum to be shown, as well as a filter to specify certain Postal Towns which would be included in the bar chart as well. This ended up looking as so:

Some of the things I included in my dashboard with accessibility in mind were:
- Removal of tooltips, checking of tab-through functionality (to essentially work through the dashboard section-by-section) and inclusion of 'ctrl+shift+enter to view underlying data' to allow for non-mouse users to see the data in more detail.
- Slightly larger font, contrast checking on coolors.co and mark labels on the bar chart itself to try and accommodate for users with visual impairment.
Although there were time-stresses and the final dashboard was not any kind of technical wizardry, these were all things which I'd never done before with accessibility in mind so it was a really informative day. Now with a broader knowledge of how to make visualisations accessible for as many people as possible, these are definitely some ideas to be incorporated in all my work moving forward.
