


Sometimes your data visualization will demand sorting by a custom value. Using the Superstore Data in Tableau we will review how you can create a custom sort on your chart.
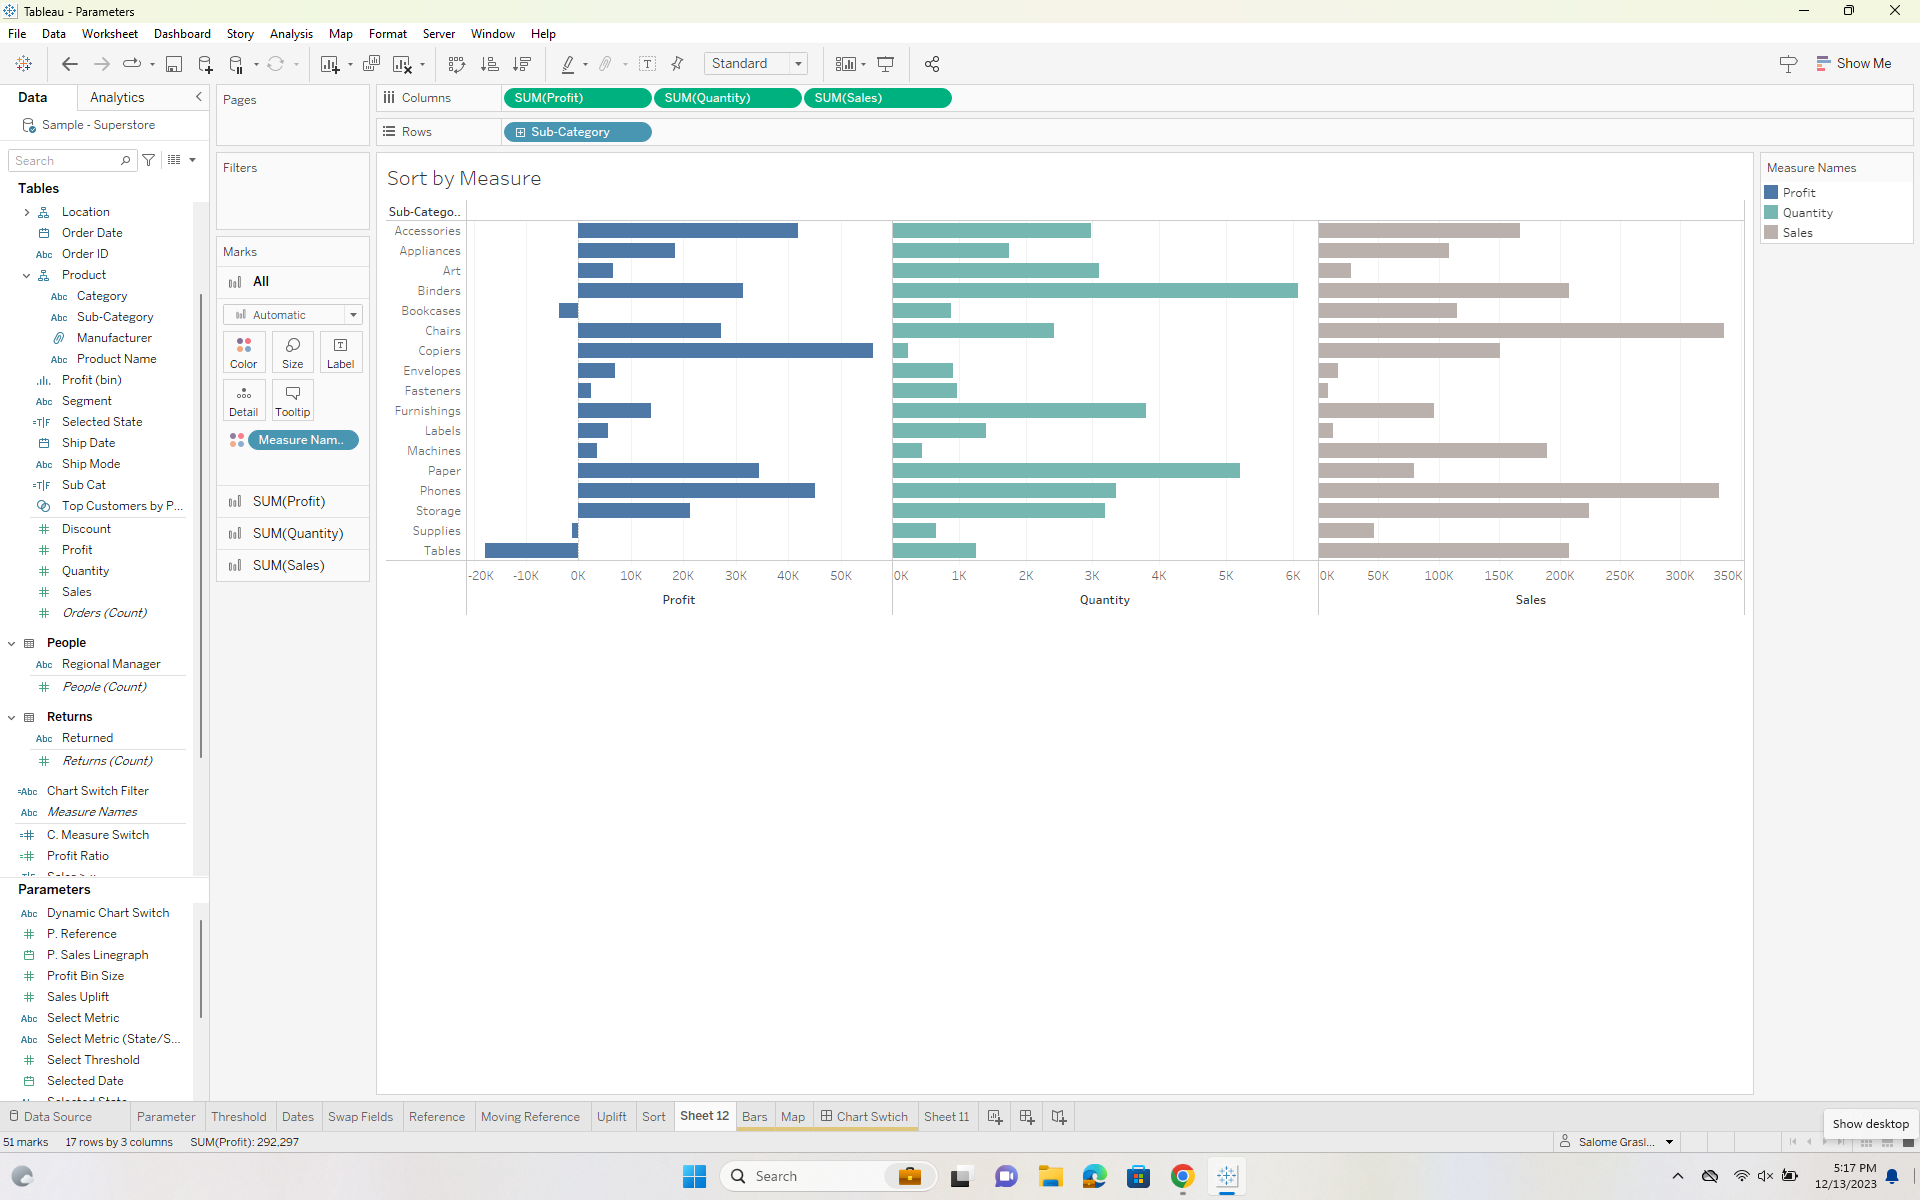
- Create a Bar Chart
Create a bar chart showing Sum of Sales, Quantity, and Profits for each of the Sub-Categories. Drag measure values to the color marks.
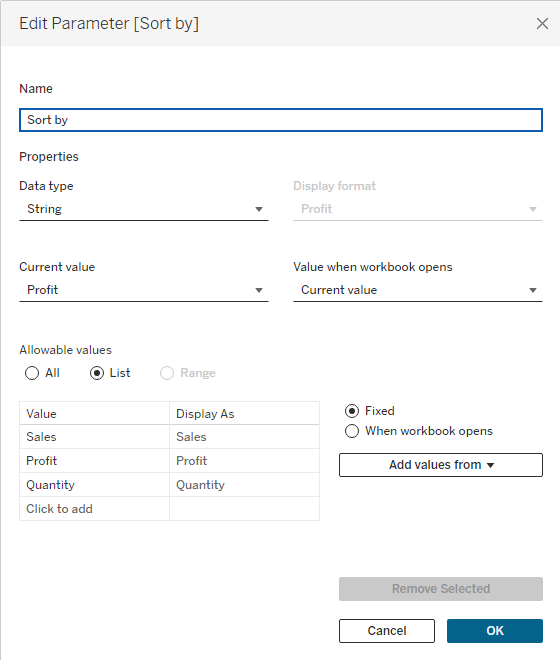
2. Create a Parameter
Create a parameter with your datatype as string and a list of the values in category. You can quickly populate this list by clicking on 'Add values from' and adding from the field 'Category'.
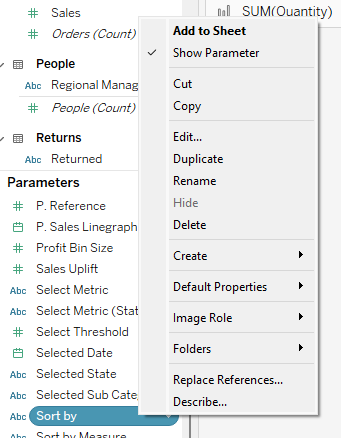
Once you've created your parameter show it on your workbook by right clicking it and checking show parameter.
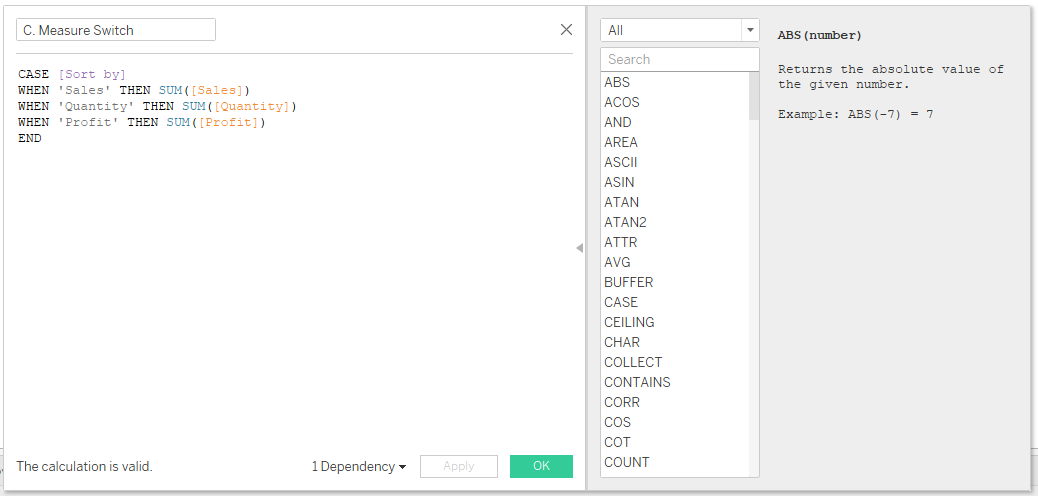
3. Create a Calculated Field
In order to sort by the category selected in our parameter we will need a calculated field. Using the CASE/WHEN function we can create a conditional statement that will select the category we want to sort.
4. Sort by Parameter
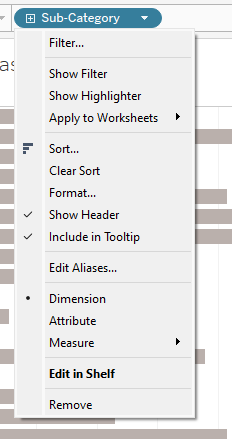
Once you've created your parameter and shown it click on the drop down menu for sub-category and select sort.
Sort by 'Nested' and change the Field Name to your calculated field.
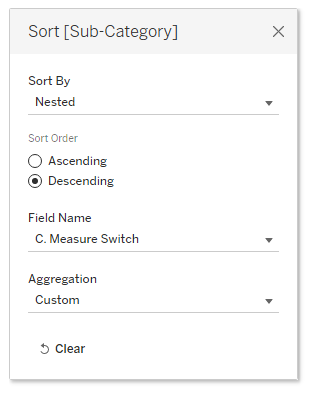
You will now be able to sort your values by selecting the category in your parameter.