Tableau has the great ability to crosstab to excel. This can be a really helpful tool for using tableau to do certain calculations that Excel may not be able to handle. This blog will cover how to create an excel sheet that contains years on column and a final column containing the variance between them.
- Aggregate for Each Year
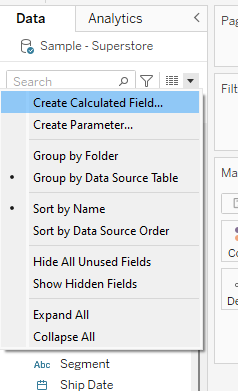
- Create a calculated field by clicking on the drop down triangle in the left hand side panel and selecting create calculated field
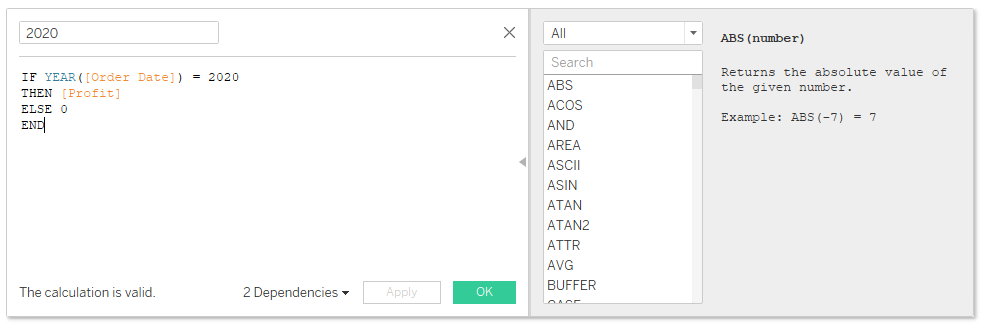
- Create an if/else statement for the year you want aggregated by the metric you want.
IF YEAR([Order Date]) = 2020
THEN [Profit]
ELSE 0
END
- Repeat the process for each year you need
- Calculate Variance
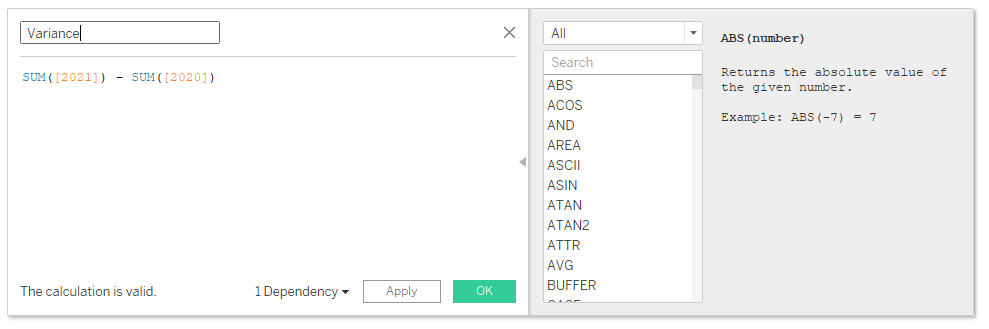
- Create another calculated field which will contain the value for variance
SUM([2021]) - SUM([2020])
- Drag the pills to row
- Drag the dimension you want to break down the view by, then years, then variance to the row shelf.
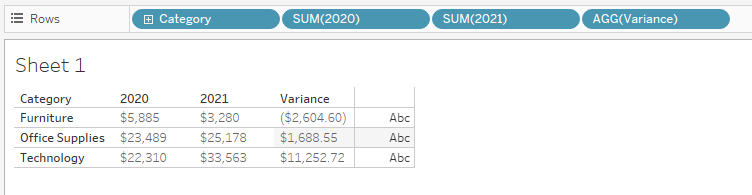
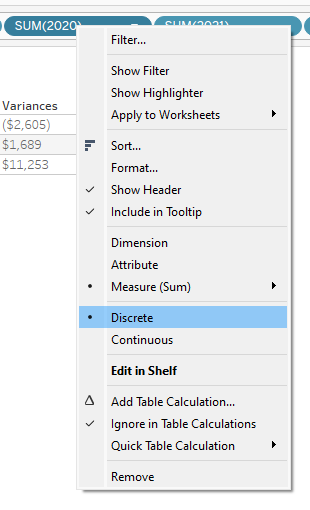
- Make sure all values are discrete by right clicking on the pill and selecting discrete
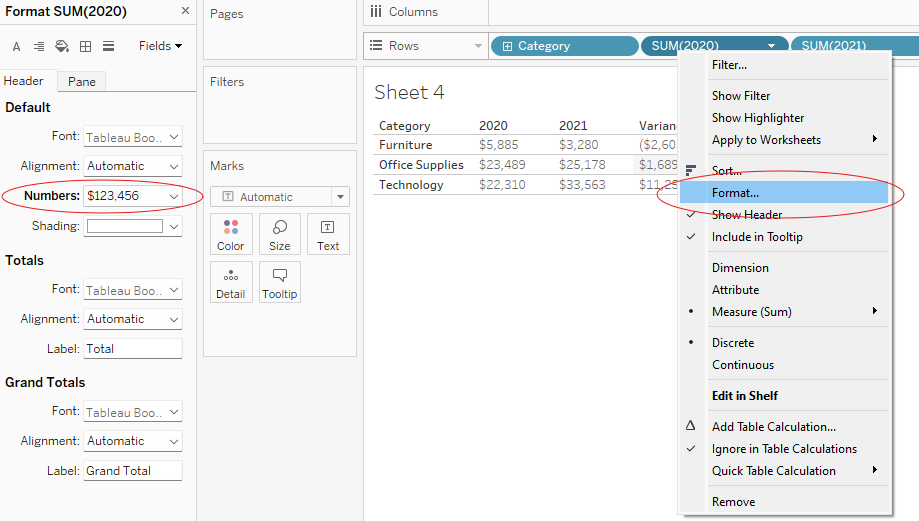
You can also format the value by selecting format in the same menu and selecting ‘Numbers’ in the left hand side menu.
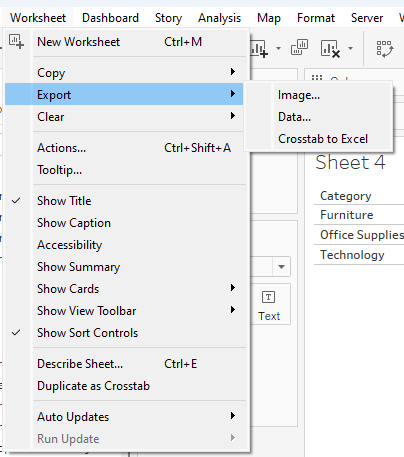
- Crosstab to Excel
- Go to the Worksheet tab at the top of the window and select export then crosstab to excel
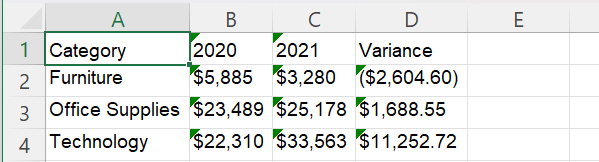
This will results in an excel sheet that looks like this: