


Today we had to access the Rick and Morty API and create a dashboard about anything we wanted from that. I chose to show where different characters reside. The idea was to be able to look into the different universes/dimensions that exist in the show along with specific locations in them to find characters.
It was quite easy to access the API today. However, preparing the data took most of my day because of how I needed to join information from multiple API calls.
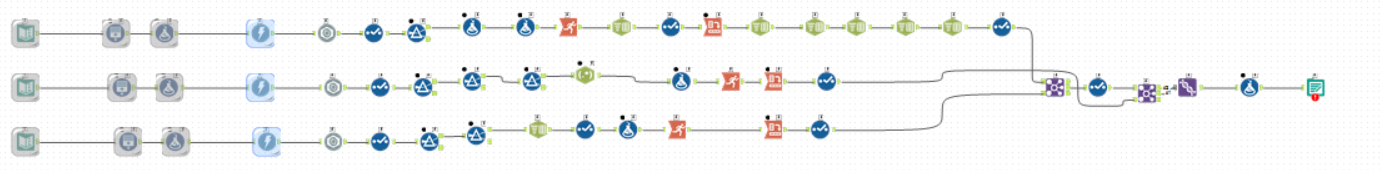
As you can see from the Alteryx workflow above, it took quite a few tools. The data for characters, episodes, and locations was separated and needed to be downloaded separately. In addition, it was all stored in separate pages. Because of that, I needed to generate about 50 different requests! The data is stored in .json files meaning that I needed to parse those files and prepare the data to be useable by tableau. After using the .json parse tool, the data comes out in separate rows for every piece of information, but we want separate columns for different pieces of information. So I needed to pull out the character IDs to group information for each character together and be able to pivot the data. In the end, I had data on each character, where they lived, and what episodes they appeared in.
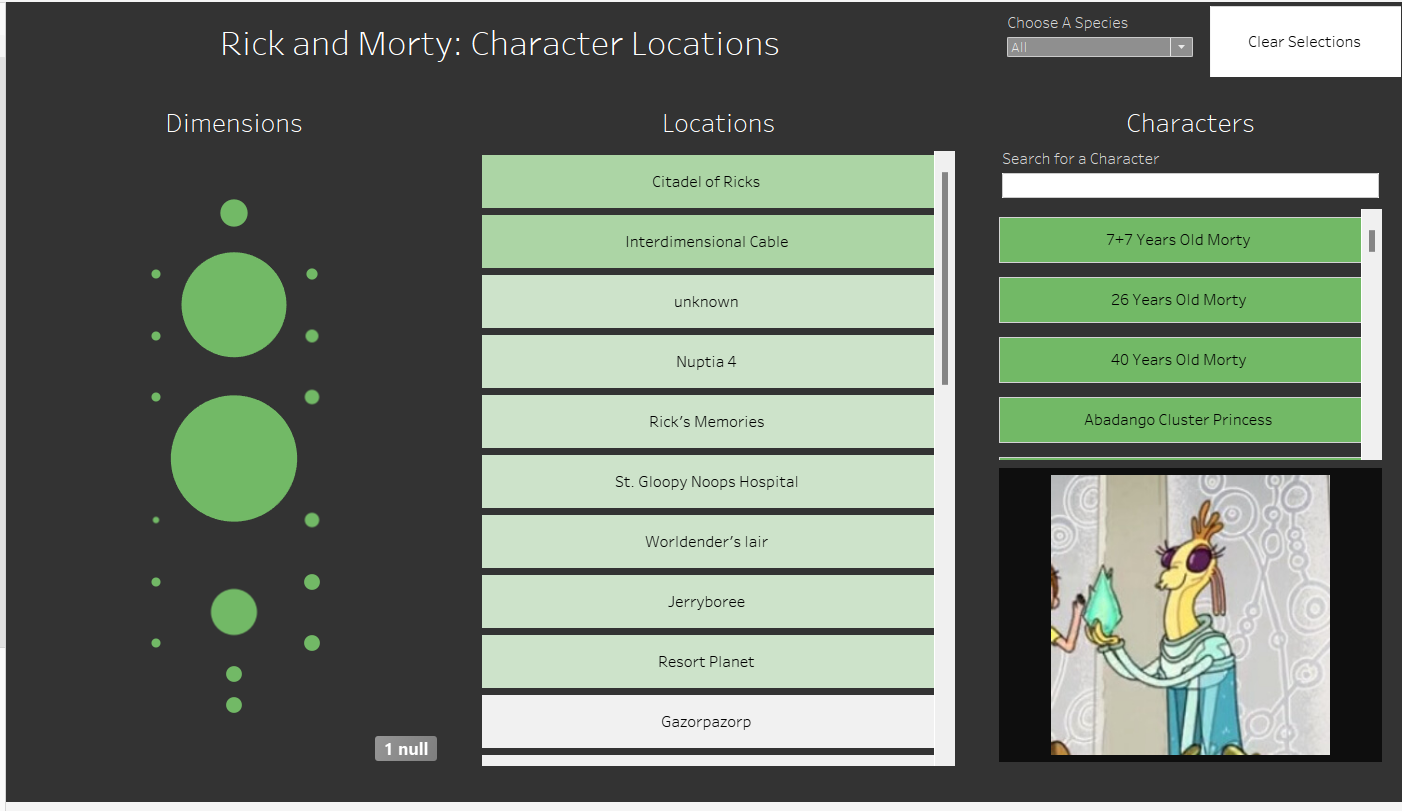
Here's the dashboard I ended up being able to build in the short time we had. We can use the dimensions and locations as filters for the characters. By selecting a character we can also get a picture of them an highlight the dimension and location they are from.