Today marks the beginning of the end, it's the first day of dashboard week. For our final week in training for the data school we build a dashboard every day, and here is a quick overview of what I did to build my dashboard today.
The task was to web-scrape the Bundesliga website and extract information about each team and how they did every year for the past 20 years. This meant going into alteryx and downloading the html code from the website to find that information.
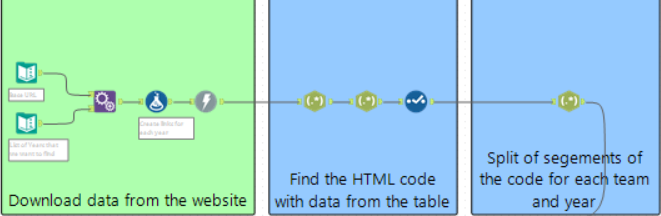
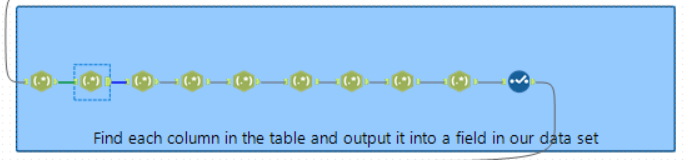
I wrote the original link into a text input and then each year that I wanted to extract in another text input. Using that I created the links for each webpage that I wanted to access. After downloading the data from each website, I began using regex to pull data from the table. That took quite a few tools since I needed a separate tool for every column in the table:
After that I did some more cleaning and outputted the data into tableau. Originally I just wanted to provide a high level overview of how each team has been performing. Here was the original wireframe I build while planning that:
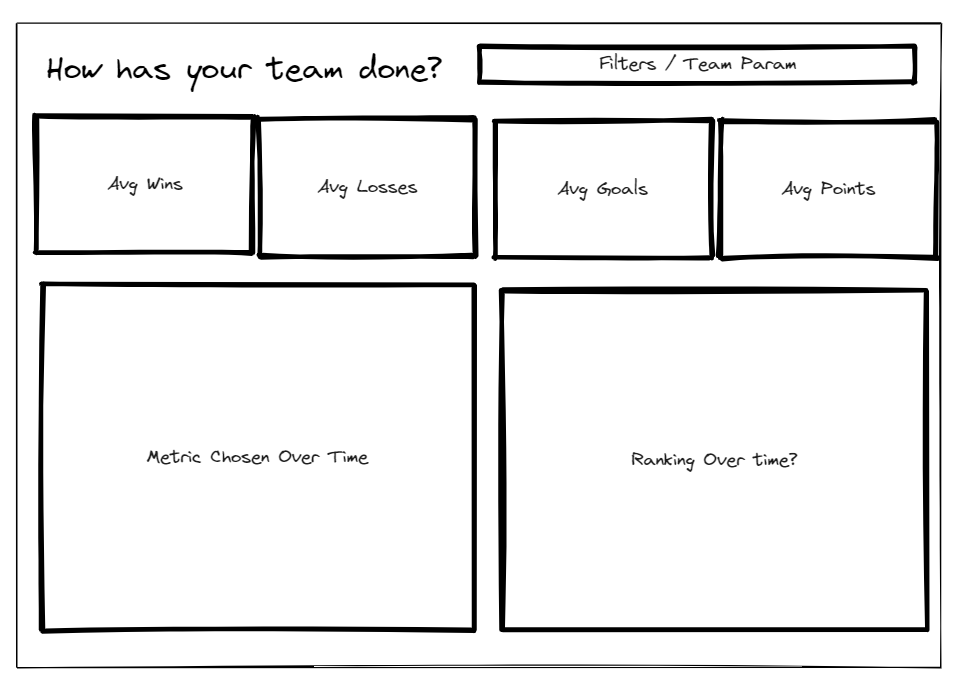
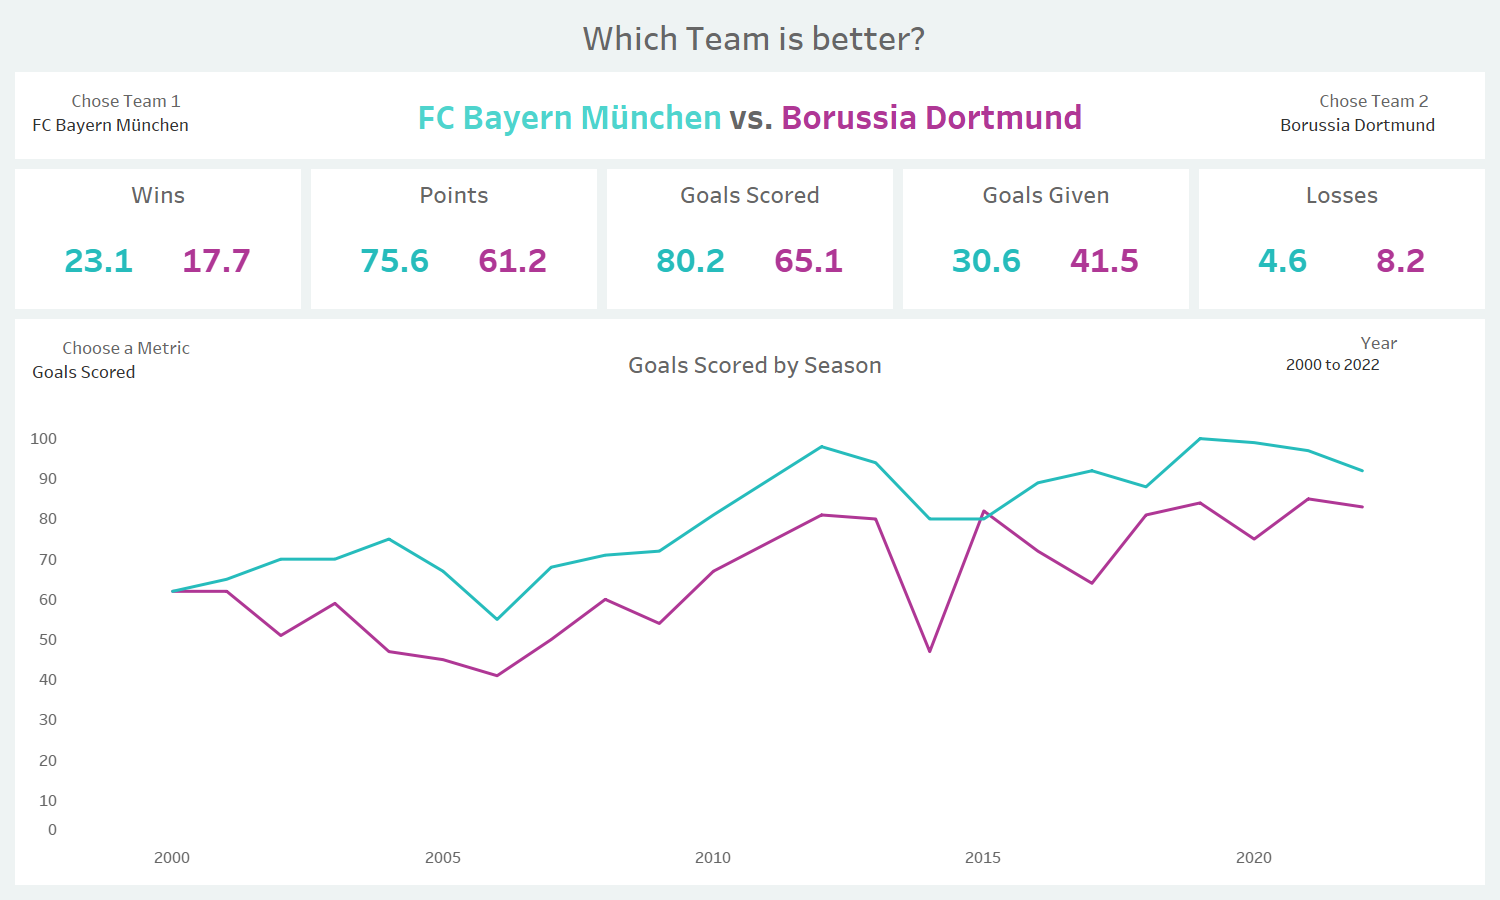
However, I realized it would be more interesting to be able to compare different teams at once. So, I gave the user the ability to choose which teams they want to compare. Here's what I came up with by the end of the day: