


Spatial objects can be quite confusing without understanding exactly what is going on. Thankfully, Tableau makes it quite simple for us. The first thing that we need to do is make sure Tableau is reading the data we input correctly. By clicking on the icon to the left of each field in the data section, we can select what type of data that field contains along with what that represents. Here is an example from the superstore data set:
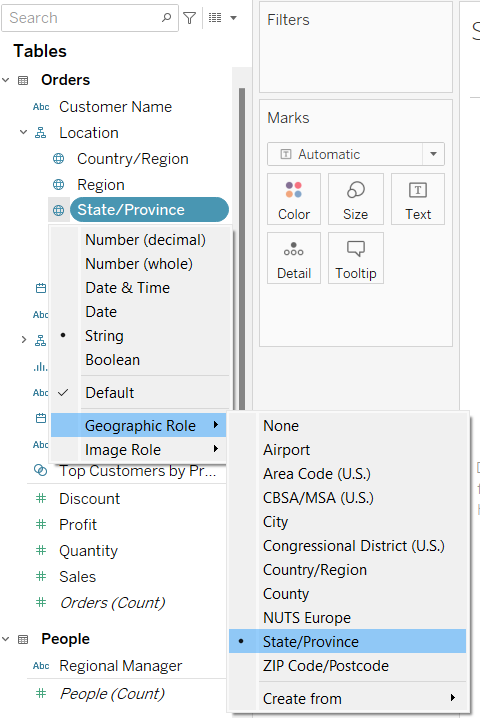
In this dataset, the fields are already mapped to the correct type. However, when using a different data set this may need to be done manually. Tableau already has the information on these spatial objects saved, so when you tell it to look at New York, it will know where that is and what it looks like for a map. This works quite well for data if it is in a format that is recognizable by Tableau. You can look here to learn more if the data you are using is not supported.
These fields do not actually contain spatial data, but it can now be used in maps like how spatial objects are. However, there are many spatial functions that can not be used with this data. Spatial functions require inputs of spatial data while a field like 'State/Province' will contain a string. To use these functions we need to have the latitudes and longitudes of each point that we want to analyze or fields that already include spatial data. Using latitudes and longitudes, we can use the Makepoint function to generate a point:

This example uses the US Flight Routes data set which comes with the latitude and longitude of each airport. Now by creating a point we can now use that point for maps and spatial functions. One useful function is the distance one.
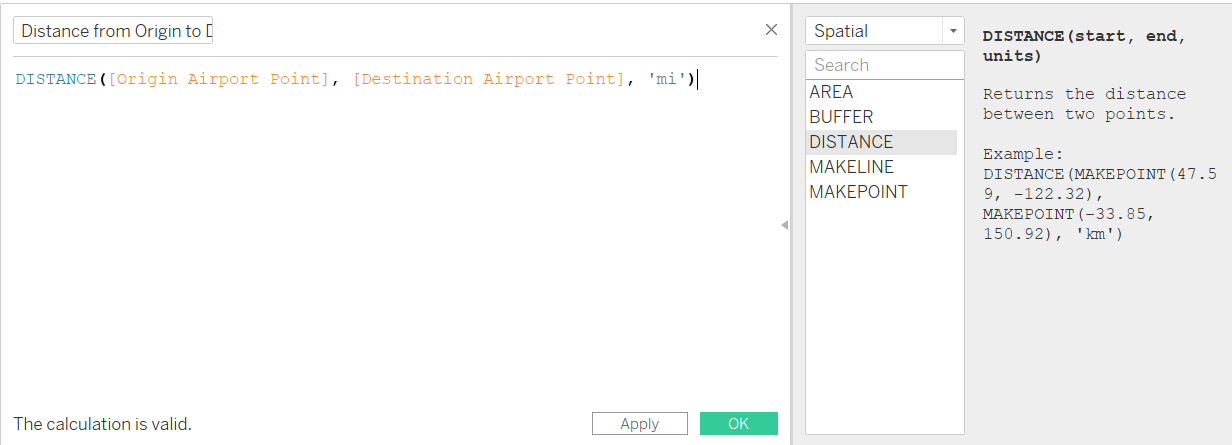
If we have the two points that we want to compare on the same row, we can now find the distance between them.