


While creating our charts in Tableau, we can quickly begin to create complex calculations that show up in our Table headers. There is a way to hide these calculations from the header and replace them with a more reasonable header.
Here's an example of a table with some calculations added:
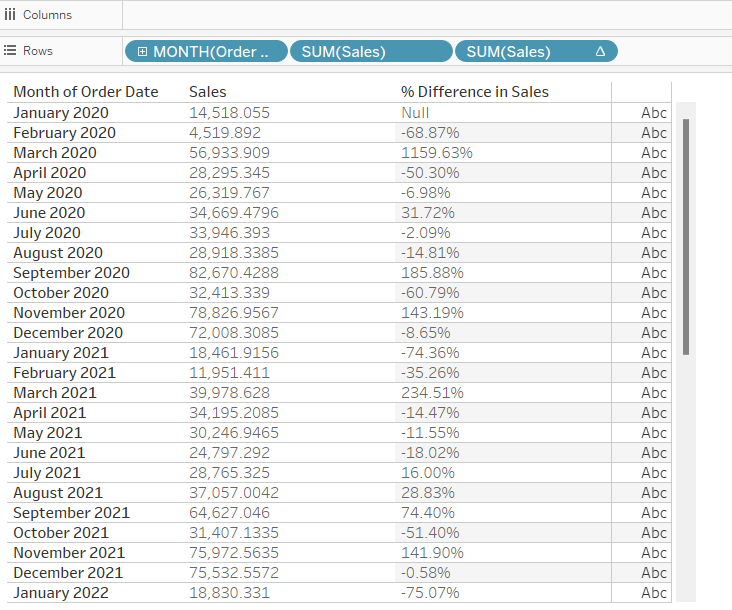
These titles are not too bad but the last one, % Difference in Sales, can be improved to make it more clear what that column is showing. To do this we can edit the pill in shelf:
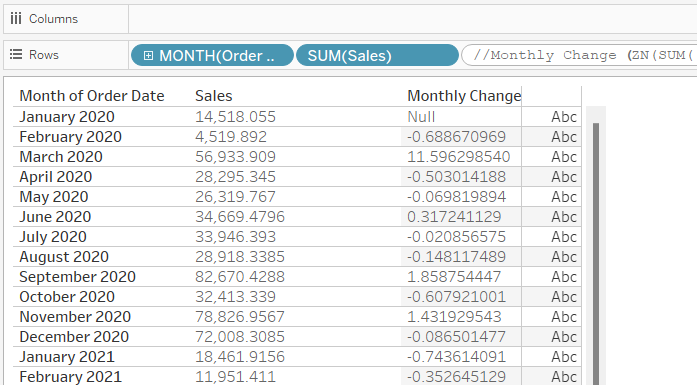
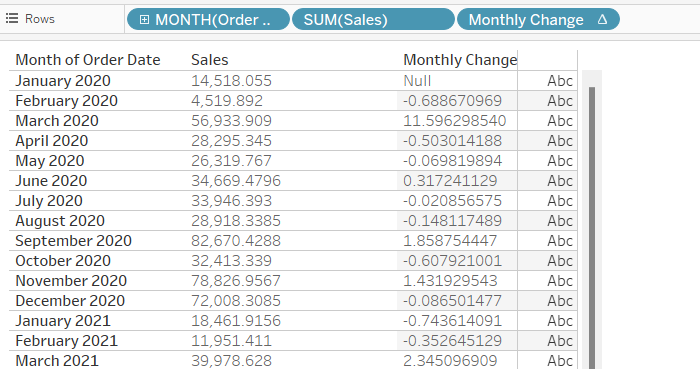
By adding the '//' followed by what we want to name the column and then hitting shift enter, we can rename the column. The shift-enter moves the actual calculation into a separate line within the pill so it does not also become a comment from the initial '//'. In this case the field became continuous after this process so I converted it back to discrete to see the numbers and here is what it looks like now:
This method can be helpful at times, but there are a few limitations. It does not work in formulas with aggregations. The Sales column here is one example of that. The SUM(Sales) is an aggregation and it will not allow you to change the name. We can overcome this by wrapping it with another calculation that would not change anything. In this case we can edit the pill to have int(sum(sales)) and then we can change the name. Changing dates also seems particularly difficult since converting a date to a string or integer will also change its display format.
Moving these calculations into a calculated field and changing the name of that calculated field to use in the table is an alternative solution. However, I tend to avoid that where possible since there may already be many calculated fields to deal with.