This challenge requires us to convert a table about stops on a marathon route onto a map. We need one map with each individual point on the marathon and another with a line representing the path. The data includes the exact location of each stop in latitude and longitude, elevation, and time. It is quite easy to complete this task with the spatial tools in Alteryx. Here's what the workflow looked like:
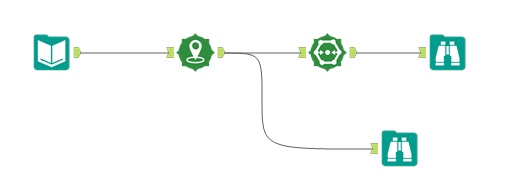
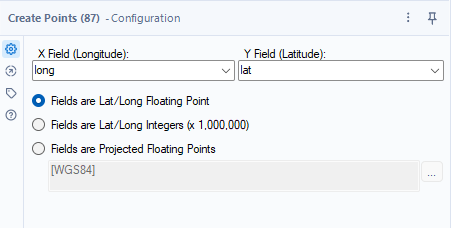
We first use the input data tool to bring in the necessary data. Then the Create Points tool can use that to generate spatial data.
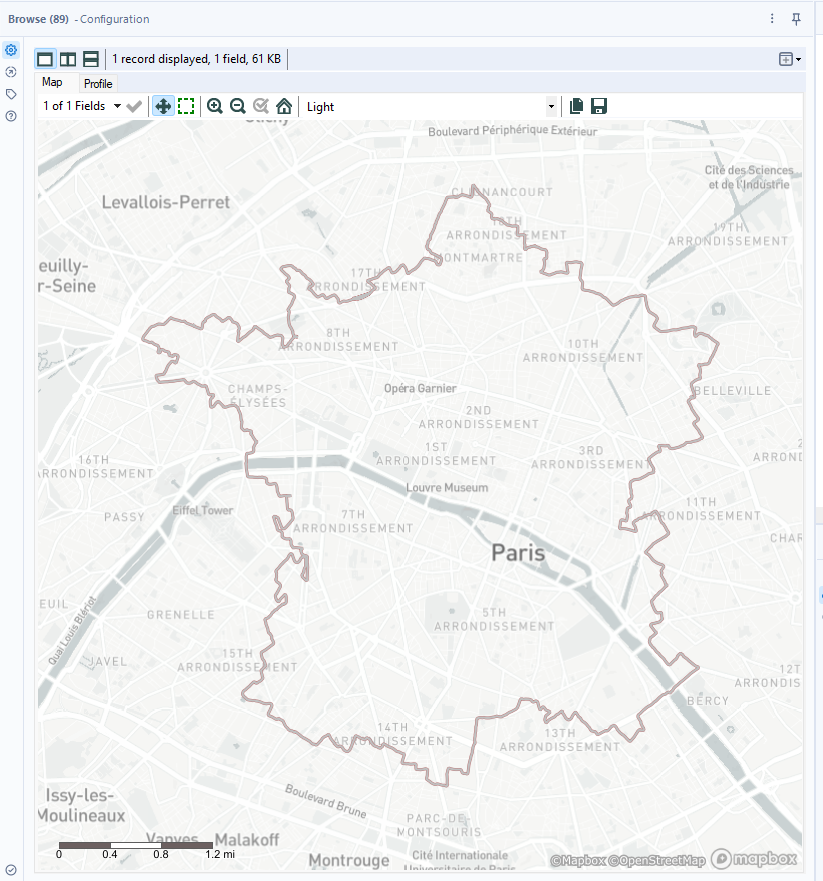
We can add a browse tool to see what this looks like on a map:
This is already part one of the solution!
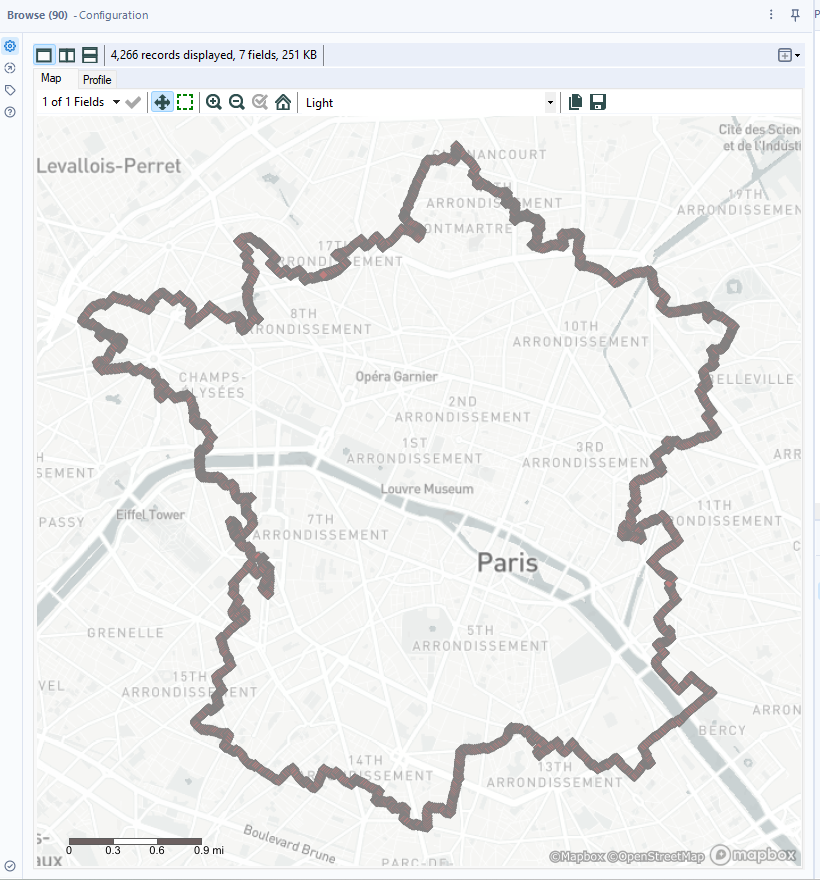
For the next part we can use the Poly-Build tool to connect these points into a line.
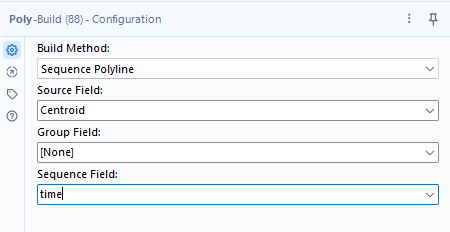
We need to select polyline for build method since we are connecting multiple points to create a line. Then, the source field is called Centroid because this is the default name that the Create Points tool gives to its output field. In this case, there are no fields to group by since we only want one line. Lastly, we choose time as the sequence field because we are using the timestamps of the marathon to determine the order of the points on the line. Using a browse tool here is the output map: