


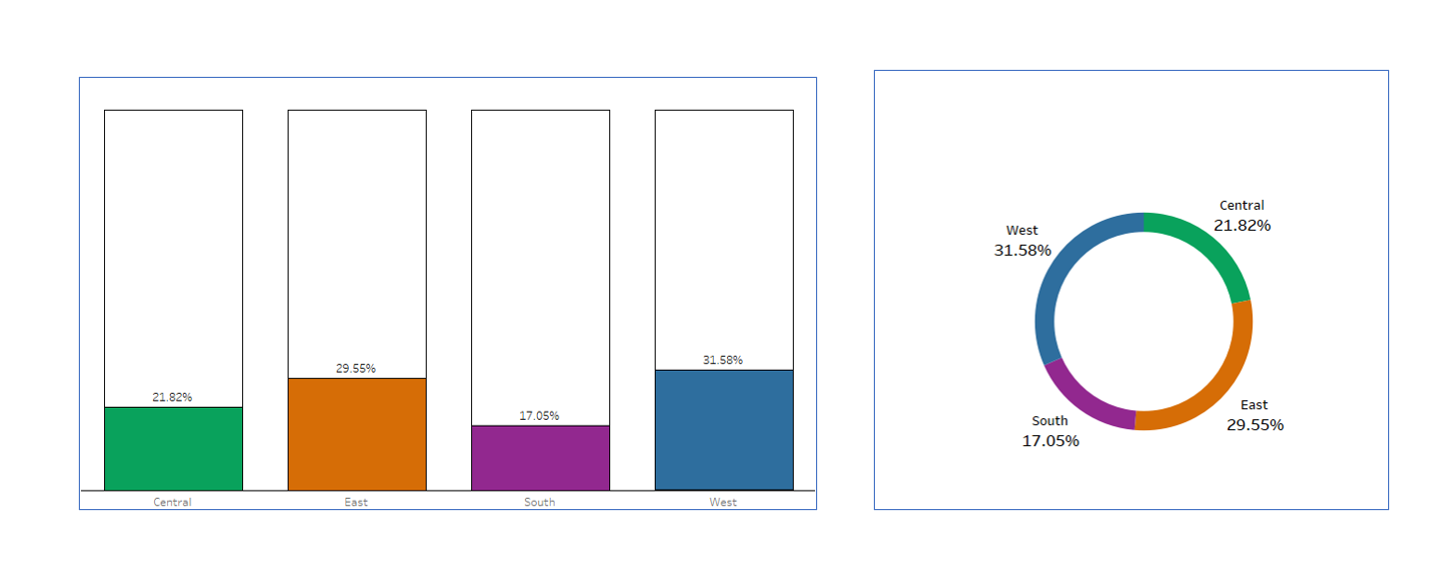
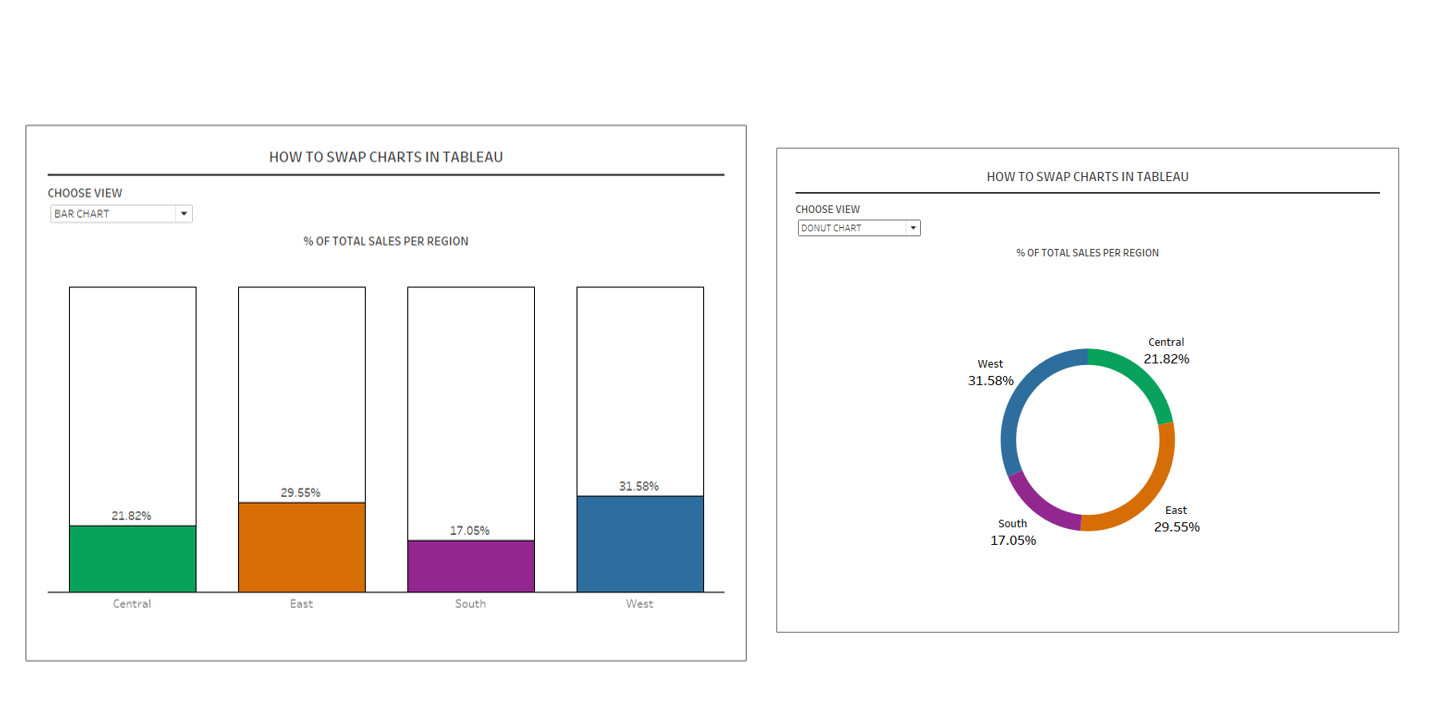
Sometimes it is nice to give the user an option of how they would like to visualise the data. You can do this by creating the same view with several different charts, and using a parameter to swap between the charts. In this case I have chosen to look at percent of total sales by region using the Superstore Data. I have created two charts, a bar chart and a pie chart.
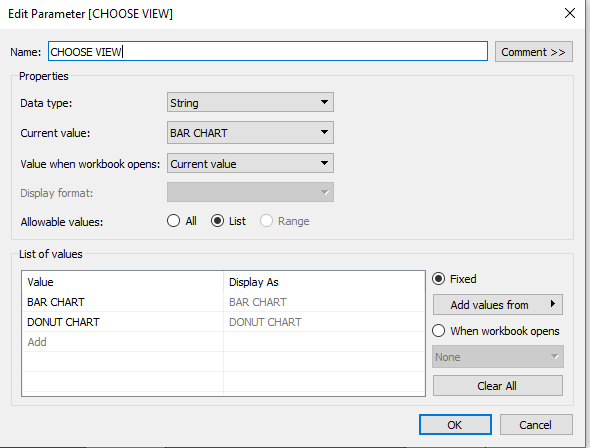
Once you have all your worksheets, create a parameter called 'Choose View' as a string data type and choose 'List' for Allowable Values. Then type out the names of each sheet as shown below.
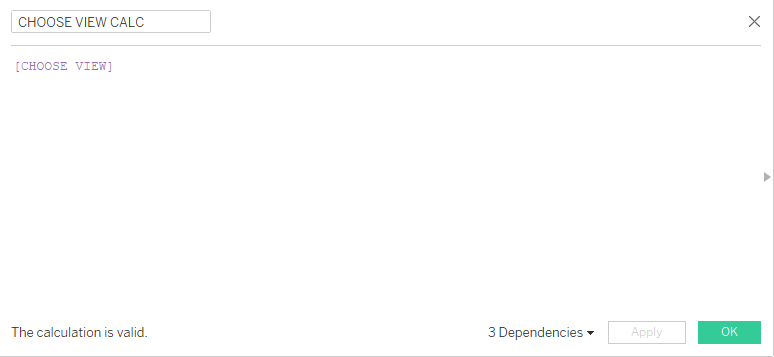
Then create a calculation that with just the parameter in it, as shown below.
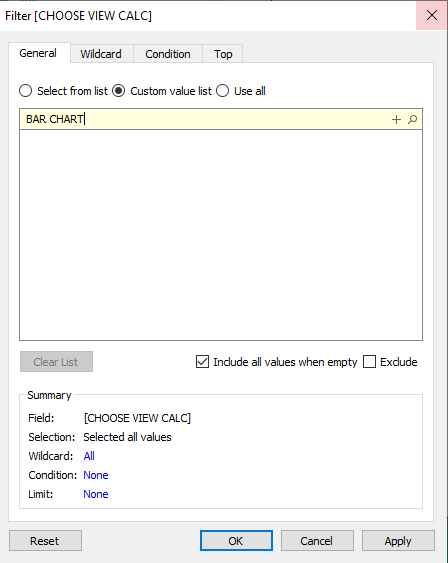
On each sheet, move the calculation to the filter shelf and choose 'Custom Value List' and type out the name of the sheet exactly as it is spelt in the parameter you set up. Then hit the '+' and hit ok.
On the dashboard, use a vertical container, insert both sheets and hide the title of each sheet. This enables the chart you haven't selected to remain hidden. Show the parameter on the dashboard and choose the view you would like to see.
This blog was inspired by a data school blog by Hashu Shenkar, you can find it here.