Transforming data from rows to columns.
What is Cross Tab?
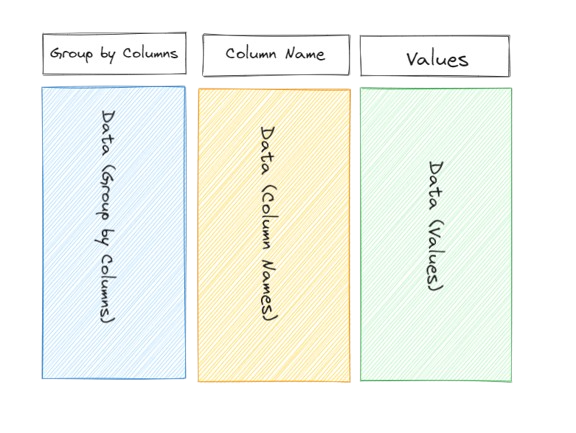
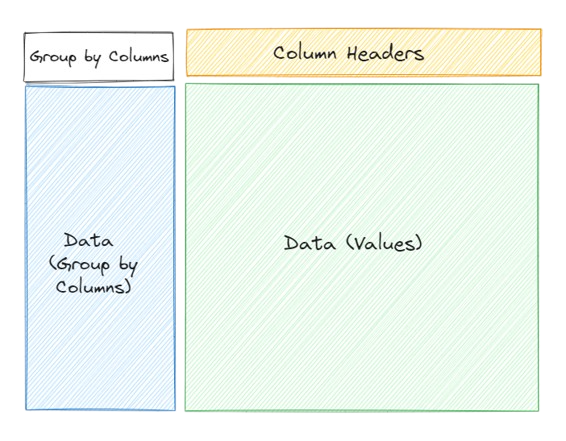
The Cross Tab Tool creates one new column for each categorical value held in a single existing column, pivoting the data from a vertical layout to a more horizontal layout. Essentially, it makes a narrower/ taller dataset wider. Cross Tab will also aggregate the data. Read my Importance of Data Structures and Pivoting blog for more information as to why you may need to transform your data.
Before

↓
After

The grouped columns stay unchanged, but data that was once in one column in different rows transforms into multiple different column headers.
Data example
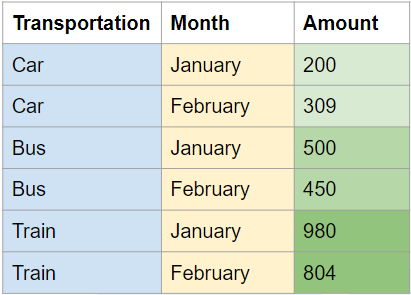
Below we have an example with transportation data. We want to Cross Tab to create a new column for each transportation method in the Transportation row (rows to columns).
Before

↓
After

or

(Output depends on whether you chose to group by or not).
Cross Tab Tool on Alteryx
Objective:
Each row represents one month.
What is the total amount for each transportation method?
Let me know if you have any questions at sabrina.vazquez@theinformationlab.com.
