


How to rank based off 2 different measures on Tableau.
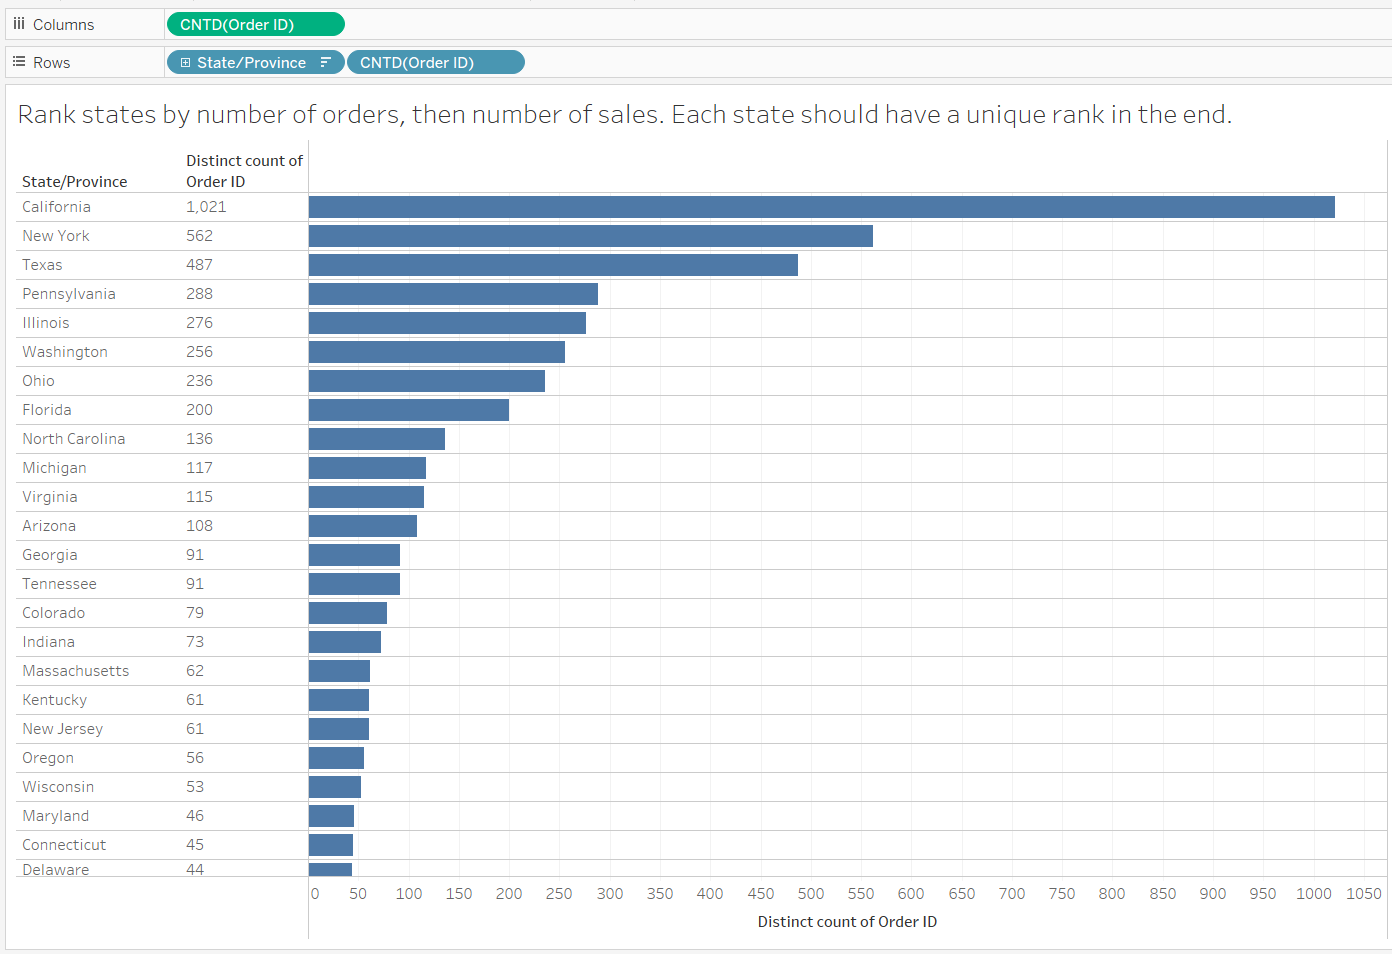
Our goal: Rank the States by number of orders, however, if two have the same amount, rank by sales. In the end, there should be a unique rank for each state with a bar chart showing amount of orders per state.
We are going to start by opening Superstore in Tableau.
STEP 1
Create a chart by dragging Order ID into columns and converting it into a measure to calculate Count Distinct. We do this to create our bar chart that shows the amount of orders each state had.
(I also included in the view the Count Distinct of Order ID as a discrete pill to view the actual numbers as I continue the work to make confirm the rank calculations are correct).
STEP 2
Create a Rank calculated field (our first of many) to calculate the rank of each state by amount of orders. The rank is calculated using Table (down). Add this calculation to the view (you may need to convert the rank into a discrete field).
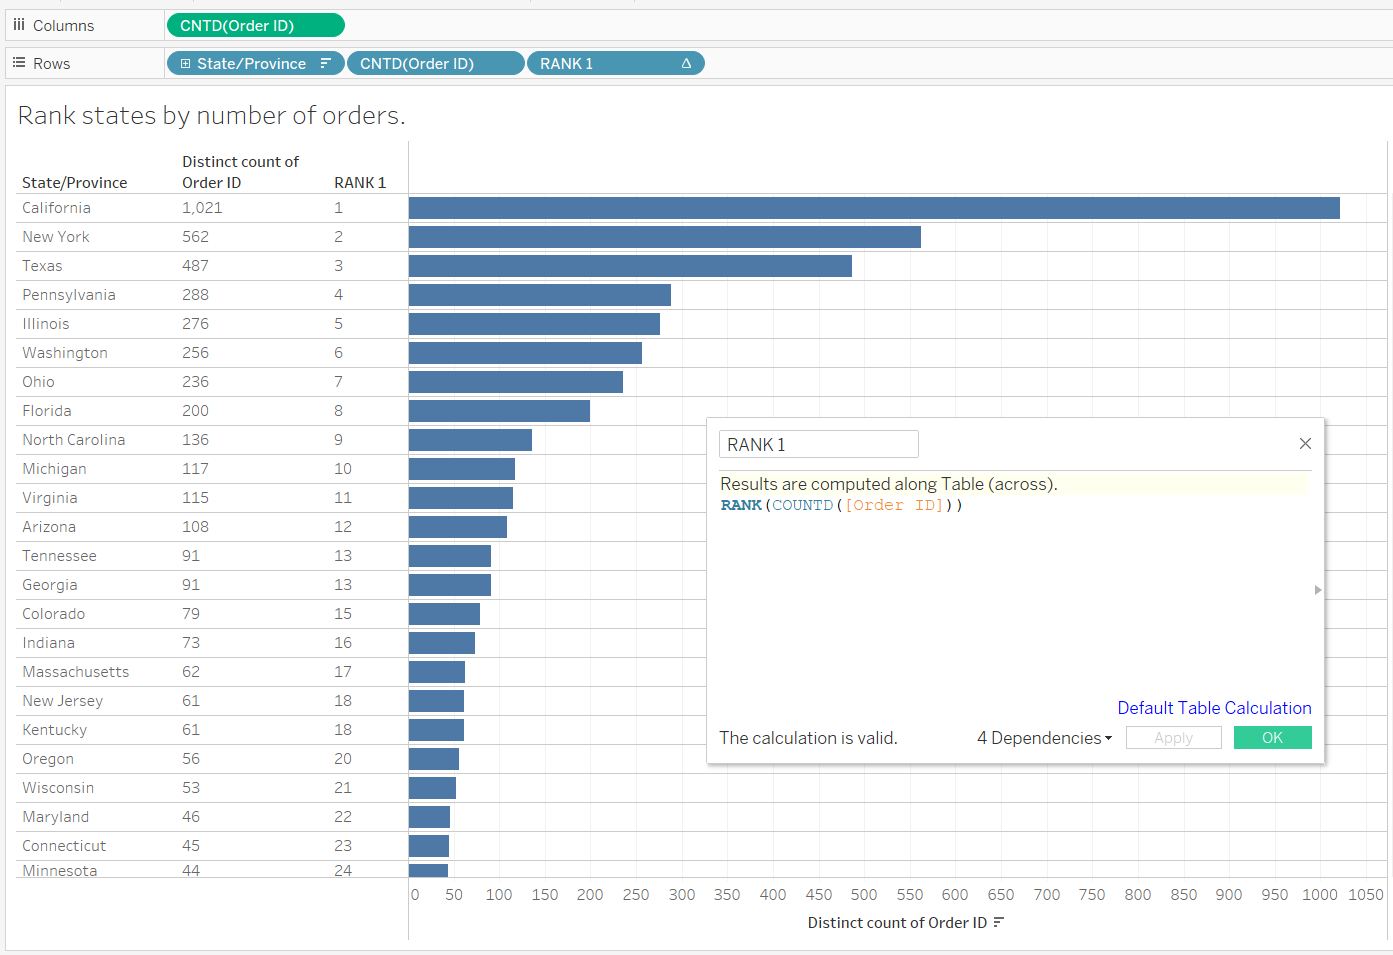
As you can see here, Tennessee and Georgia have the same amount of orders (13), therefore, they have the same rank. We can also see that with New Jersey and Kentucky (18). This is the problem we are trying to solve.
STEP 3
Create a Rank calculated field to calculate the rank of each state by the total sales. The rank is calculated using Table (down). Add this calculation to the view (you may need to convert the rank into a discrete field).
(I also included in the view the Sum of Sales as a discrete pill to view the actual numbers as I continue the work to make confirm the rank calculations are correct).
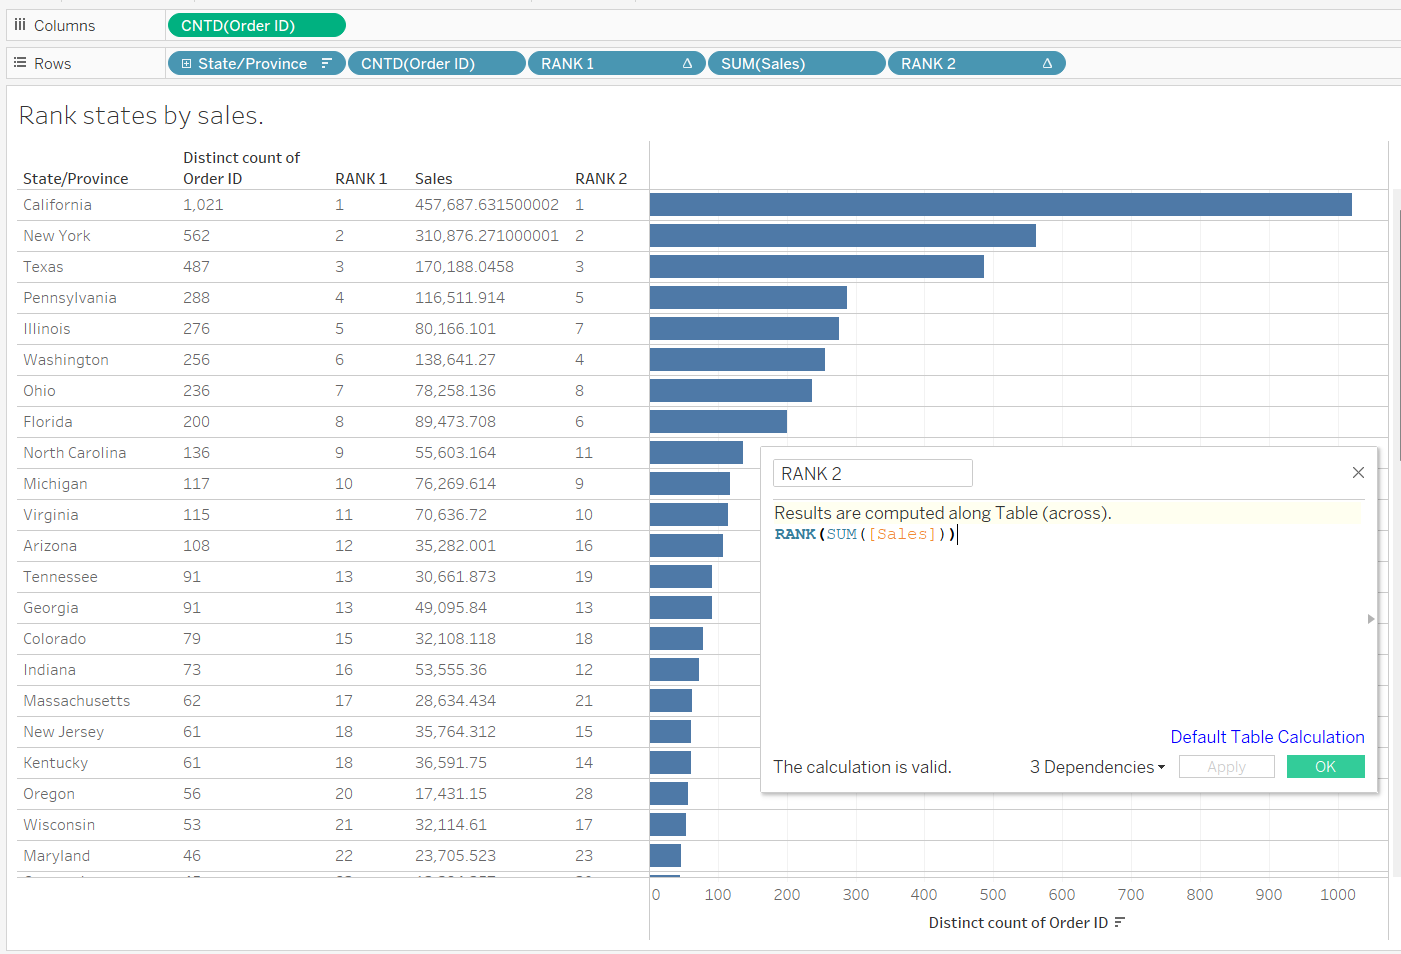
As you can see here, although Tennessee and Georgia have the same amount of orders (13), Georgia has higher sales, and should therefore be at a higher rank than Tennessee.
STEP 4
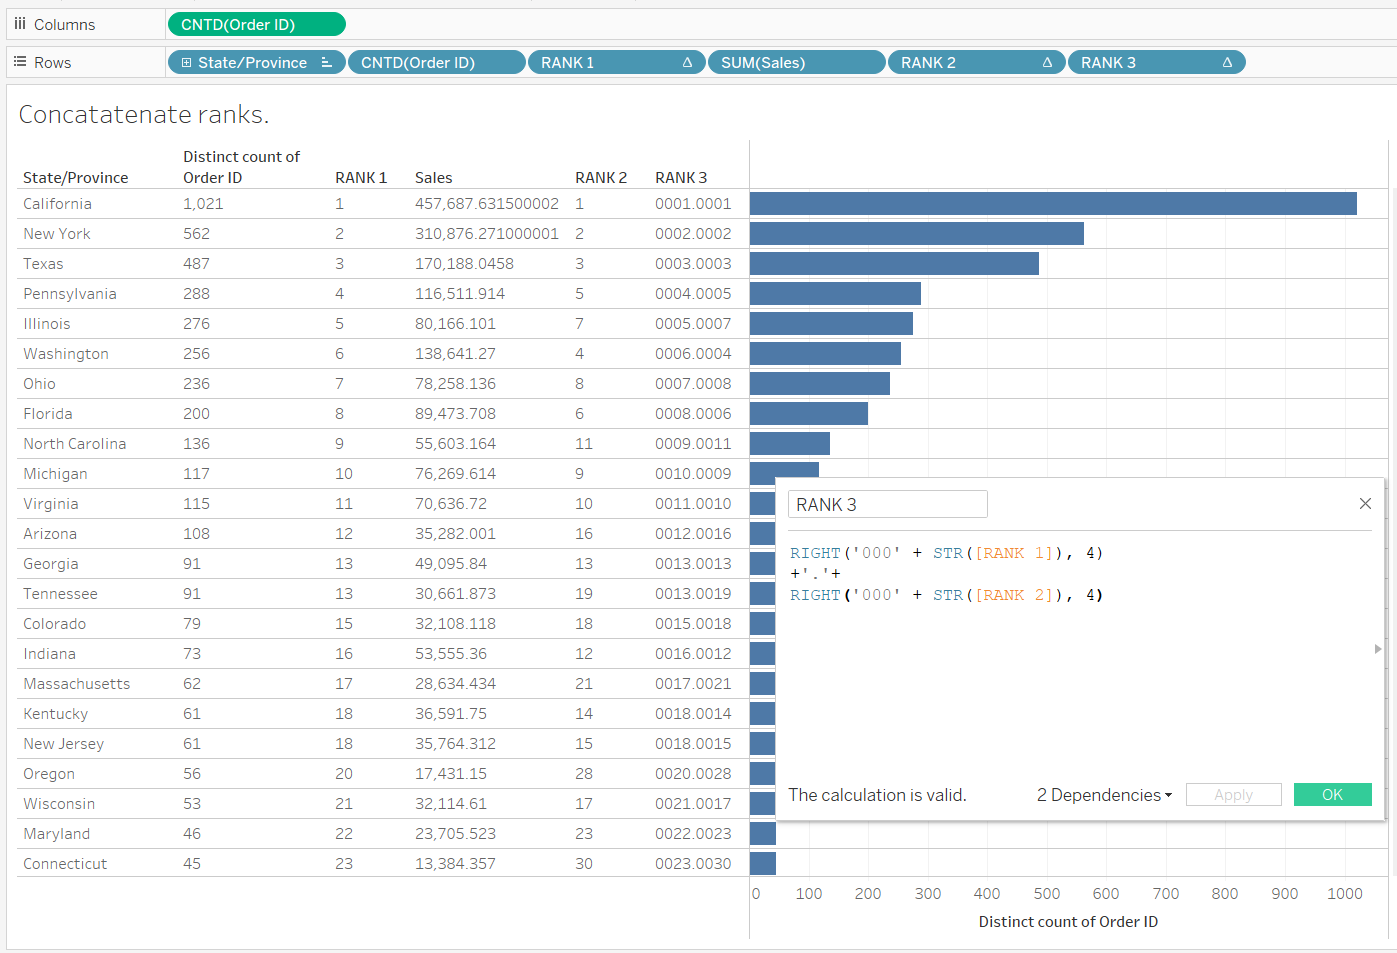
Create a calculated field to concatenate the rank of each state by amount of orders (RANK 1) and total sales (RANK 2). We do this by creating a string to create a number that takes into account both ranks. We add zeros to account for values after the decimal (0.3 versus 0.13 would make the 13 smaller than the 3, which would be incorrect). The rank is calculated using Table (down). Add this calculation to the view (it should be discrete and a string data type).
STEP 5
Finally, create a calculated field that ranks the concatenated rank (RANK 3) by ascending order. The rank is calculated using Table (down).
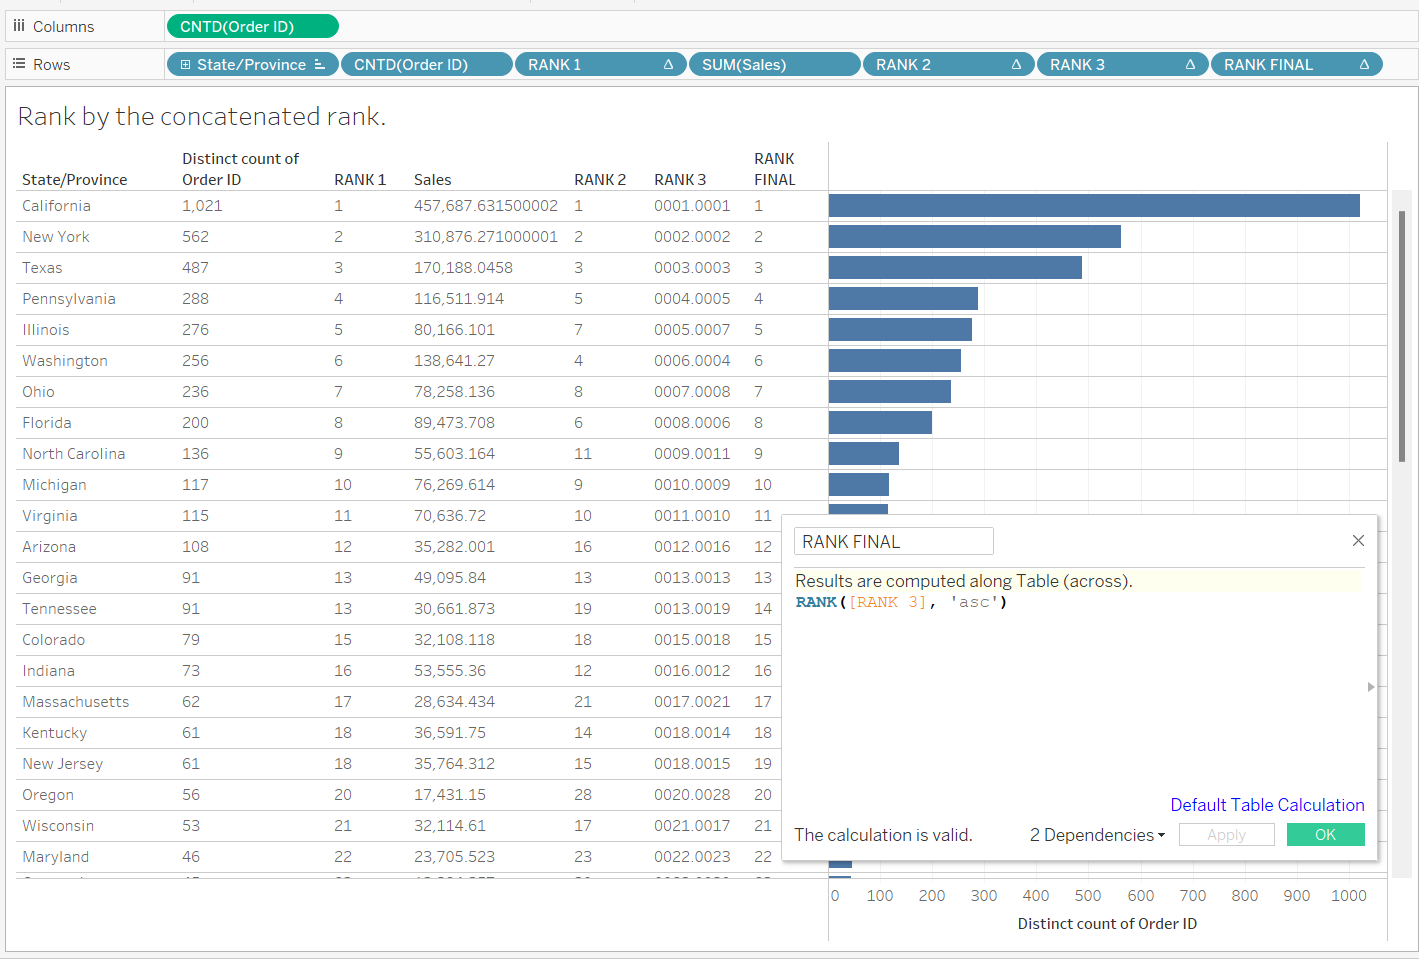
As you can see here, Tennessee and Georgia now have their own unique rank and since Georgia has higher sales (13), it is at a higher rank than Tennessee (14).
STEP 6
Final step is to format the view to answer the question and remove any extra fields.

This is one way to solve the multirank ask on Tableau. Try it for yourself and let me know if you have any questions at sabrina.vazquez@theinformationlab.com.