


This last Dashboard Week blog marks the end of my training here at DSNY. This last day was difficult physically, but thankfully not mentally like other days in the week. New York City went into a state of emergency after I arrived in the office (late because of the rain), so the priority of going home safe was held higher than our graduation celebrations and the project at hand. Therefore the importance of today was to get home safe before the rain situation got worse and when it came to the project: Scope down (I have said that every blog this wee, but today it was especially important).
In today's blog I am going to be including time stamps to show what I was able to achieve in such a limited time period.
The Ask
9:10 am- 9:15pm
The last project for this week is a Data School New York tradition where we are tasked to make a visualization using use the application data set for the cohort that begins after DSNY 5.
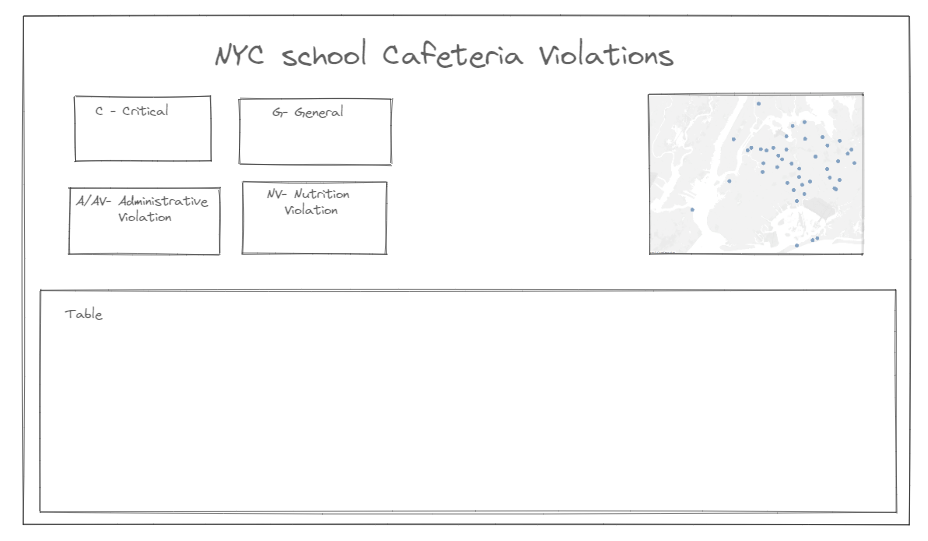
Wireframe
9:20 am - 10:00 am
As soon as I saw the different types of violations, I thought about drawing inspiration from my Help Desk Ticket Dashboard.
Showing the four types of violations as different levels of violations, wanted the dashboard to be interactive, so when you click the KPI, you can filter the table below.
The KPIs will either be bars or a line showing the change of number of violations of each level over time. I hope this can filter the table below by date.
I also wanted to include a map element so a city can be chosen and the schools in that city would populate the table.
Data Prep
9:15 am - 9:20 am
Today's data set was relatively clean, so not a lot of data prep was necessary. I did open up Alteryx however, for a few minutes to view the data and do some basic data exploration.
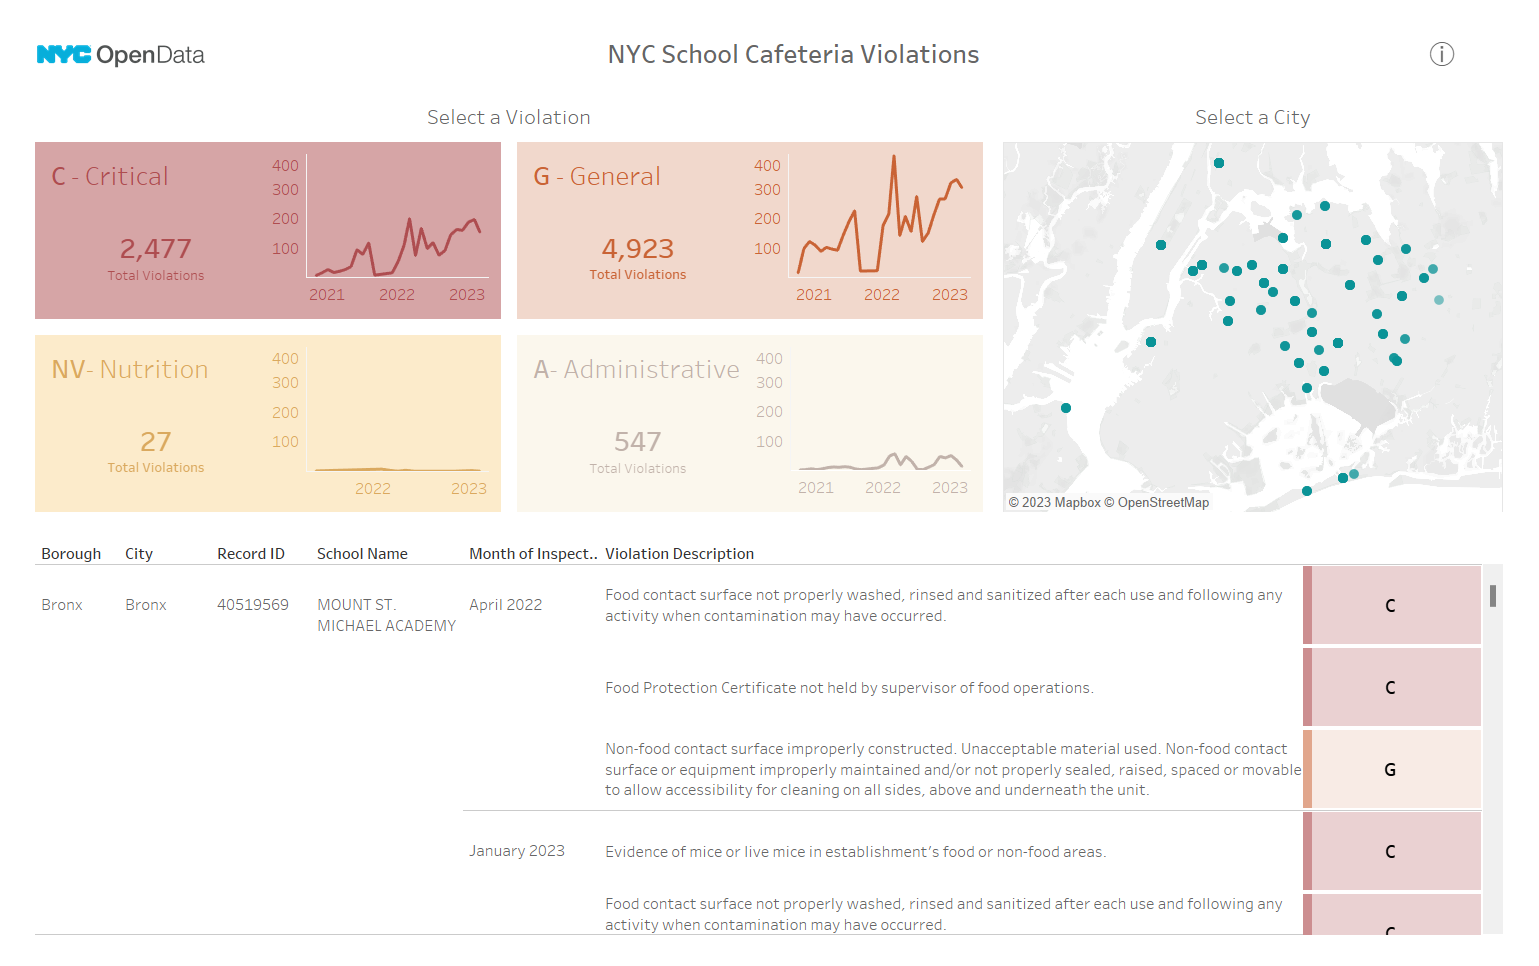
Dashboard
10:00 am - 2:00 pm (including lunch time)
Building the dashboard was actually a positive experience. With the chaos around me, I was able to focus on my vision and build the dashboard I had imagined.
Since I had built a similar dashboard, I did not actually struggle in the building which was good. However, I am disappointed that I could not achieve the main fix from the last dashboard that I wanted to do which were dynaic axes. I wanted to be able to switch between uniform and individual axes for the KPIs since the smaller numbers are harder to see, but individual axes would be a manipulation of data to the eye.
My dashboard is definitely more of an exploratory dashboard rather than analytical. I thought it could be used by a parent who is looking to see the cafeteria violations situations in their city or an adjacent one to see whether they want their child at that school or not.
See my final dashboard here: DashboardWeekDay5NYCSchoolViolations
Returning Home Safely
2:00pm - 3:20pm
This time includes finding a location with WiFi to present from since I did not have internet at home and my phone had no more capacity for hotspotting. Many coffee shops with WiFi were closed, but thankfully I found one that was open (coffee shop number 5).
Presentations
4:00pm - 5:00pm
Todays presentations were different for a number of reasons.
- Presentations consisted of the cohort being half remote and half in office.
- We hadn't received feedback all week, but we got detailed feedback and we were asked questions about the choices we made for the dashboard.
- We had an audience! DSNY5 sat through our final presentations and supported us throughout. Thank you DSNY5!
Blogging
5:00pm - 5:30 pm
I tried to finish this blog in 30 minutes, but there was a lot that I wanted to stay, so I wrote as much as I could and plan to finish it on Monday. I know how helpful these blogs can be so I tried my best to make them as detailed as possible.
Hope you enjoyed reading about my experience this week and if you're going into Dashboard Week, Good Luck!