Welcome to the first blog of the series for Dashboard Week. This week we are tasked each day to produce a dashboard and blog as well as other deliverables such as a documented data prep workflow and wireframes. Day 1 was about Bundesliga Team Scores for each season. We were given a website where we needed to have a dataset with information about at least the last 20 seasons. Besides that and showing teams' performance over time, the rest was up to us.
Wireframing
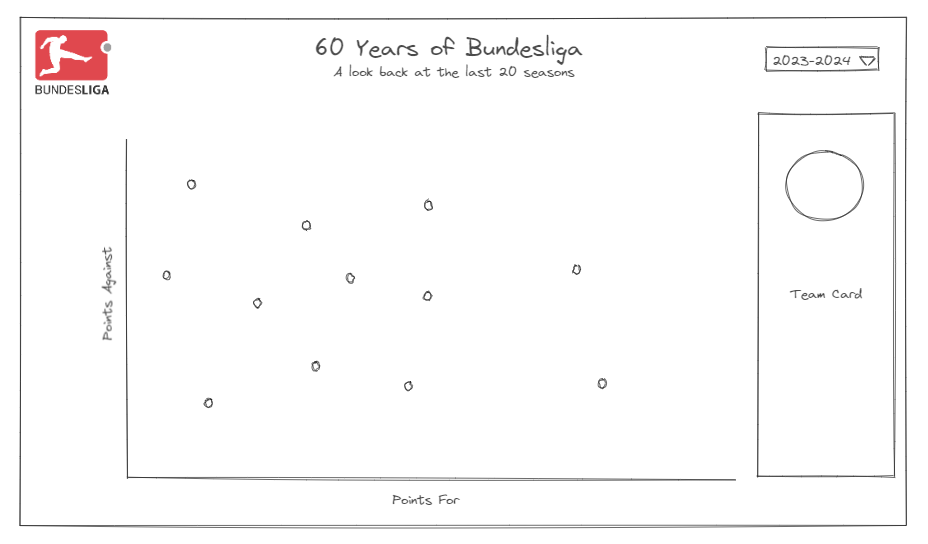
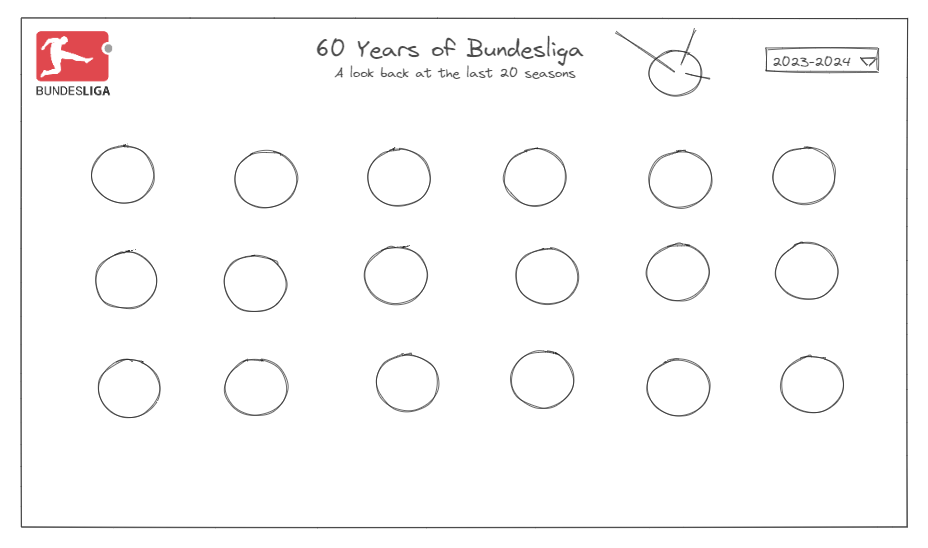
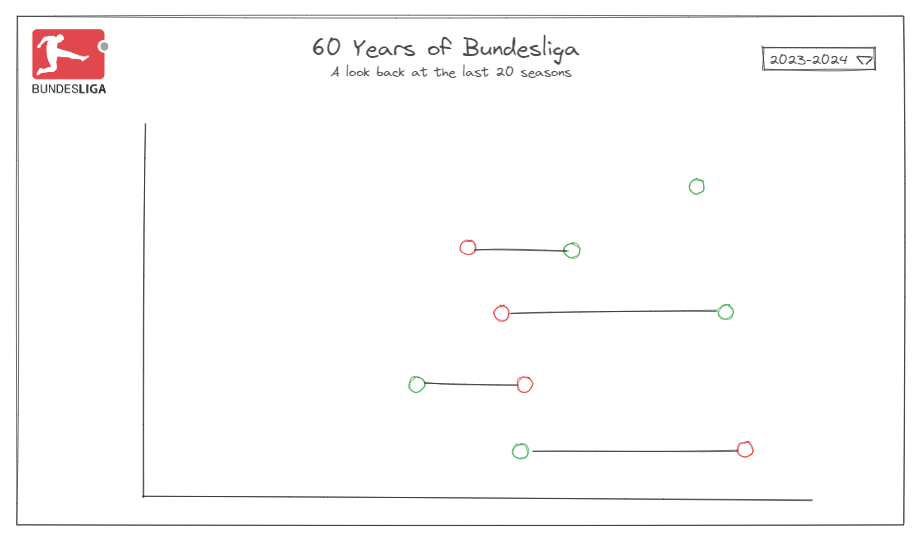
Wireframing can feel tedious, however, it can be very helpful when it comes to visualizing your ideas and scoping. Wireframes were a requirement so I made sure to get it done as soon as possible.
After looking at the website I drew out a few ideas of charts I can produce.


None of these were final, but it helped guide me in what data I for sure needed and data I didn't need.
Webscraping
Todays data came in the form of a website about Bundesliga data. It has been some time since I had webscraped, so I knew this part would be particularly challenging. For this reason, I stress the importance of Wireframing so you have an idea of what you want to show so you know what data you actually need. Nothing us worse than trying to regex a field you do not actually need. I used Alteryx for this step as that is the only tool where I know how to webscrape.
I thought I did not remember how to do this, but I looked back at another project I had worked on and worked backwards from that, especially when it came to pagination. I thought I got away with not hard coding the pages, however, using the multirow formula is just a fancy way of hardcoding (at least I did not do it in Excel like some others).
In the future, I would like to implement an iterative macro to make sure the pagination is dynamic.
Regex
Regex can be fun except when you're in a time crunch. This section took the most amount of time.
To regex the table we need to get the data, there were different fields I needed:
Team Rank, Team League, Team Logo, Team Name, Wins, Draws, Losses, Goals, Goal Difference, and Points.
I attempted these different methods to Parse/Tokenize the fields above:
- Doing them all at once
- Separating League info then doing it all at once
- Doing League and team each separately, then doing the numerical(-ish) data
I ended up going with the last one. I separated alphanumerical data, then the numerical. I was successfully able to achieve all of this without many hiccups, however, I found parsing out the Team Logo to be out of scope.

Dashboard
Since I had many different ideas, I started to think which were in scope and which weren't. This led me to scrap the starburst chart as it is a complicated chart that I have never built, so I do not think I would be able to achieve that in time.
I was left with two different types of dashboards: a scatter with a team card (possibly showing the team's past results in the tooltips), or a barbell chart.
I started by building both. I wanted to see if one or the other looked better. However, this is the moment when we are supposed to stop and think what are we trying to show, not just what looks better.
So I asked myself: What am I trying to show/ answer with my dashboard?
I needed to show team's performance overtime for the past 20 seasons and keep in mind what sort of comparisons might my audience want to make and how can I provide a smooth experience enabling them to find answers to their questions?
I ended up with a combination of both.
See my final dashboard here: 60 Years of Bundesliga

Presentation
We have from 9 am until 3:30pm to finish all the tasks as once the clock strikes 3:30pm, presentations begin. Thankfully, presentations were the least stressful as we have presented to each other countless times at this point. I made sure to outline what I wanted to say with notes and went in the order that I did in this blog to help organize myself. The presentations went well and it was great being able to see what the rest of the cohort produced with the same data and time constraints. Proud of all of us!
Blogging
The last task of the day was to submit a blog about the process of building the dashboard. I took into consideration advice to blog as I build and I would highly recommend doing that. It made writing this blog much easier and I plan to do the same for the rest of the week.
Hope you enjoyed reading about my experience and see you tomorrow for my next blog for Dashboard Week Day 2.
