


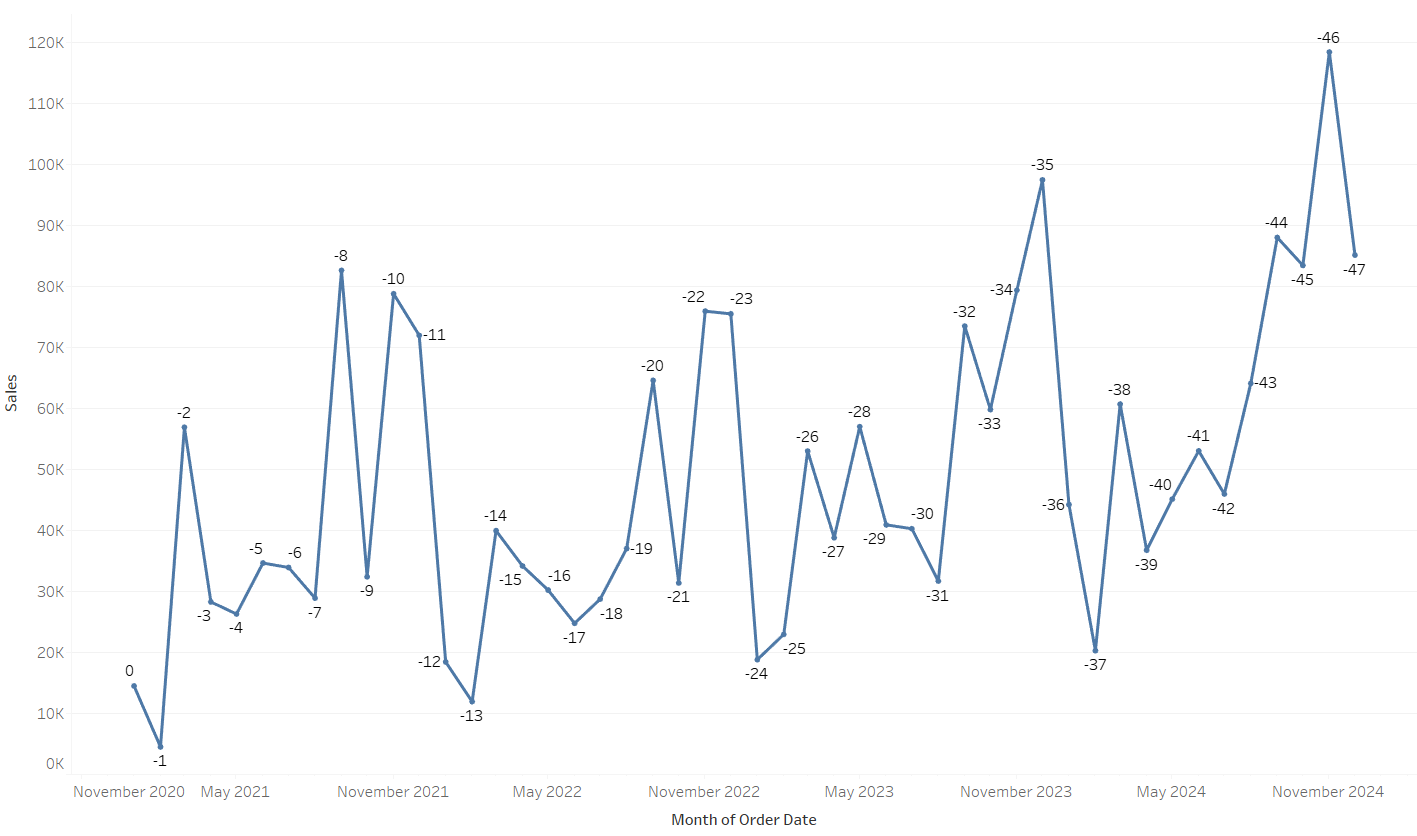
There are three different functions that can be used on Tableau Desktop to determine the position of data: FIRST(), LAST() and INDEX().
The FIRST() function identifies the first data point and numbers it 0. The data points which follows are negative integers so the order is as follows: 0,-1,-2...-n where is the most recent point. This is displayed in the the line chart below which shows sales across time:
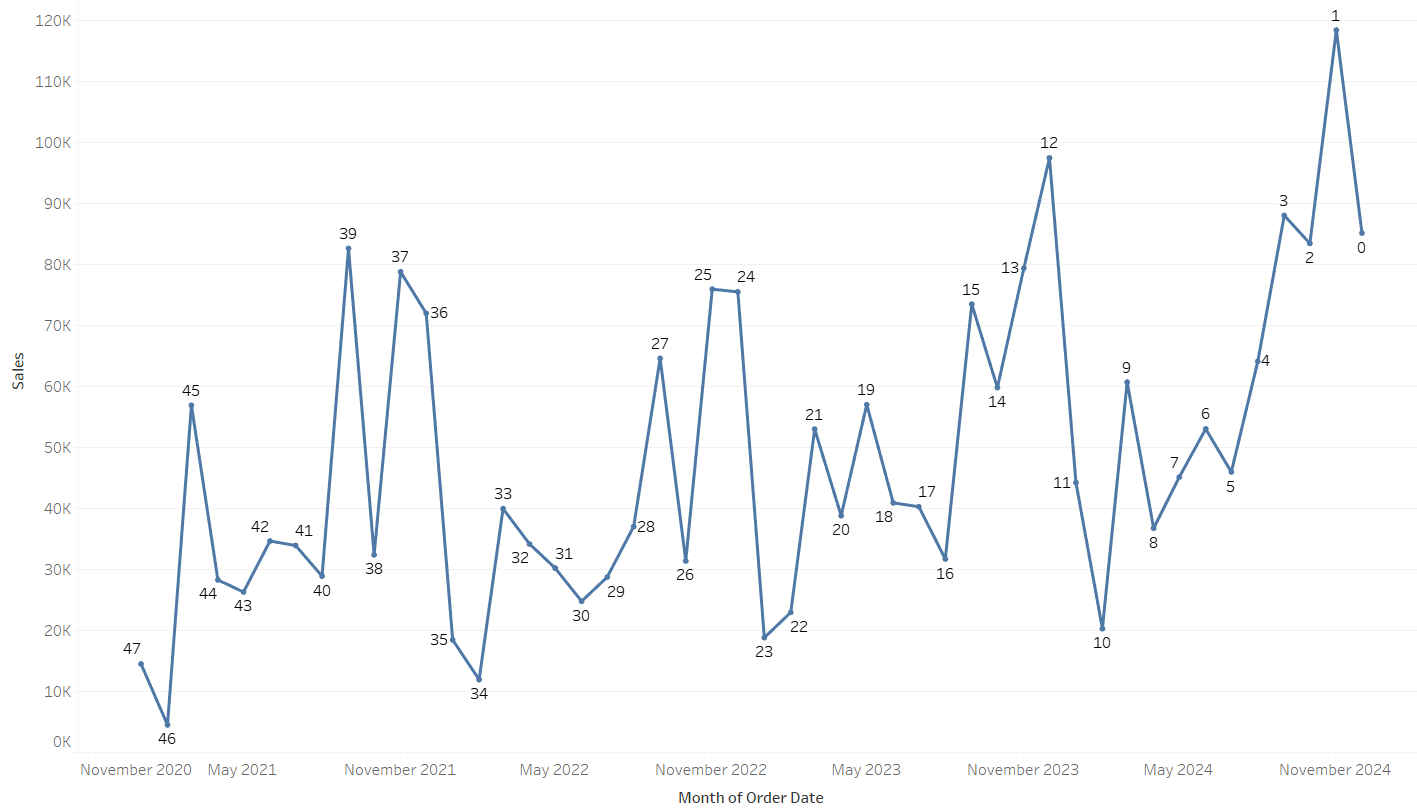
The LAST() function is similar to the first function however it takes the most recent point as 0 and the points lead to the final point with be labeled as positive integers: 0,1,2...n. This is displayed in the line chart below:
Finally the INDEX() function labels the index of a row of the fields specified within the table calculation. Unlike the FIRST() and LAST() function, the INDEX() function starts at 1 instead of 0. This is demonstrated in the line chart below:
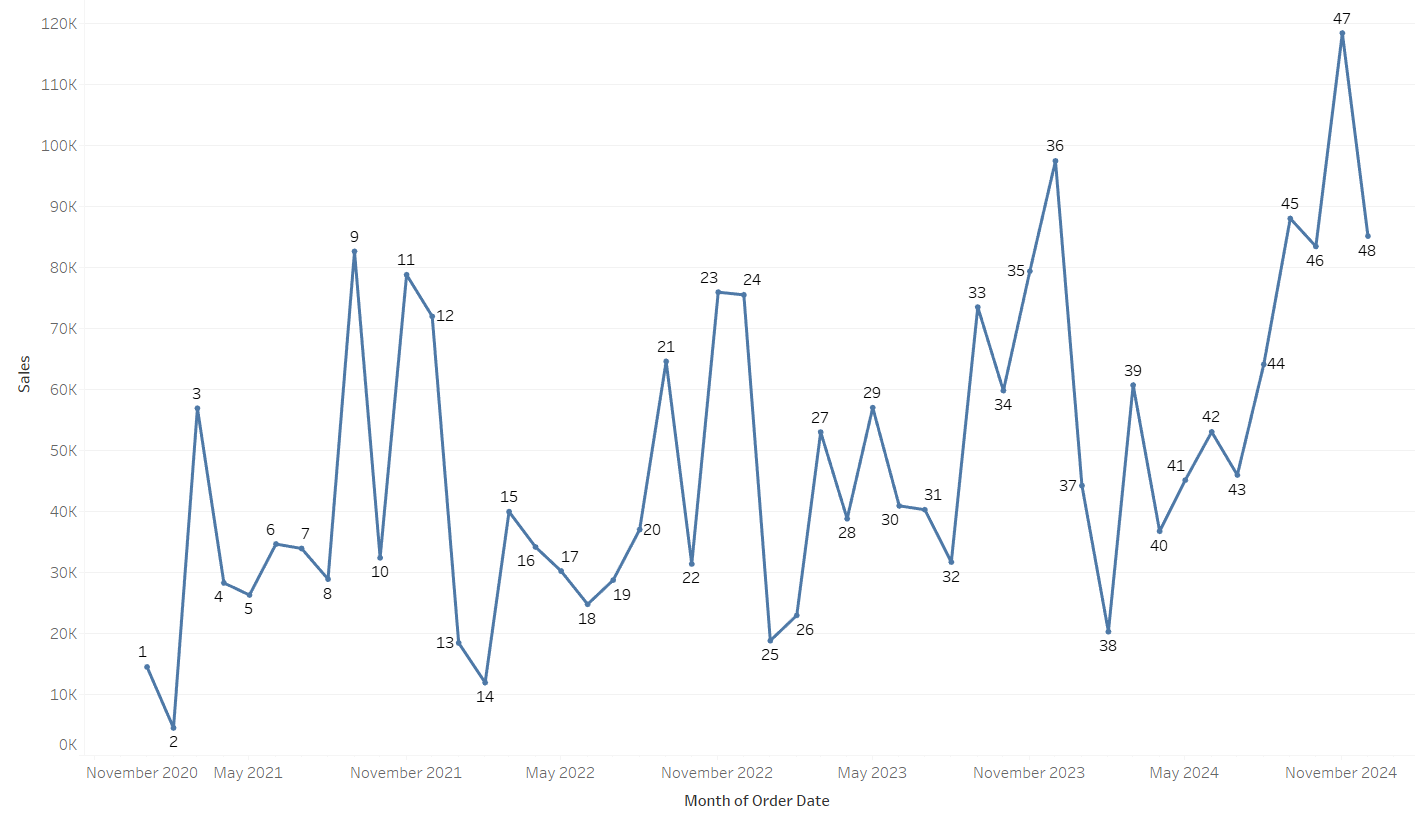
As the calculations are table calculations, we can edit the table calculation and specify how they are calculated.