Today was DS43's first day of Dashboard week. We were tasked with using SQL on Snowflake to prepare our data before using PowerBi to analyse and visualise our findings. This was something I initially found quite daunting as I do not enjoy Power Bi very much and find it challenging to use.
I started of by going through the data set and writing down what each row of data represented. I then wrote out my user story so that I knew which datasets and the fields within the data sets which I required. I then looked through the data once again and sketched out what I thought my desired output should look like. This took me longer than I expected as there was repeat in field names across different sheets despite not the fields not representing the same data.
Once this was completed I started working on SQL where majority of my code was to join tables. I found the code slightly challenging to write however writing out my desired table and plan for prepping my data was very helpful. The code I resulted in was:
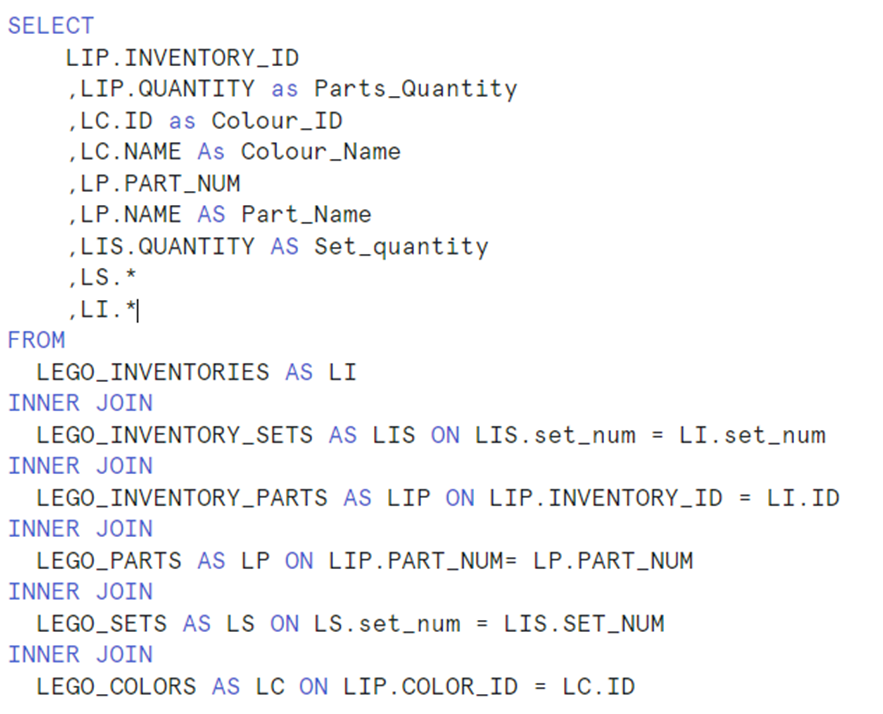
After finishing my code, I planned my dashboard which lead me to the just before lunch. The plan I was left with is:
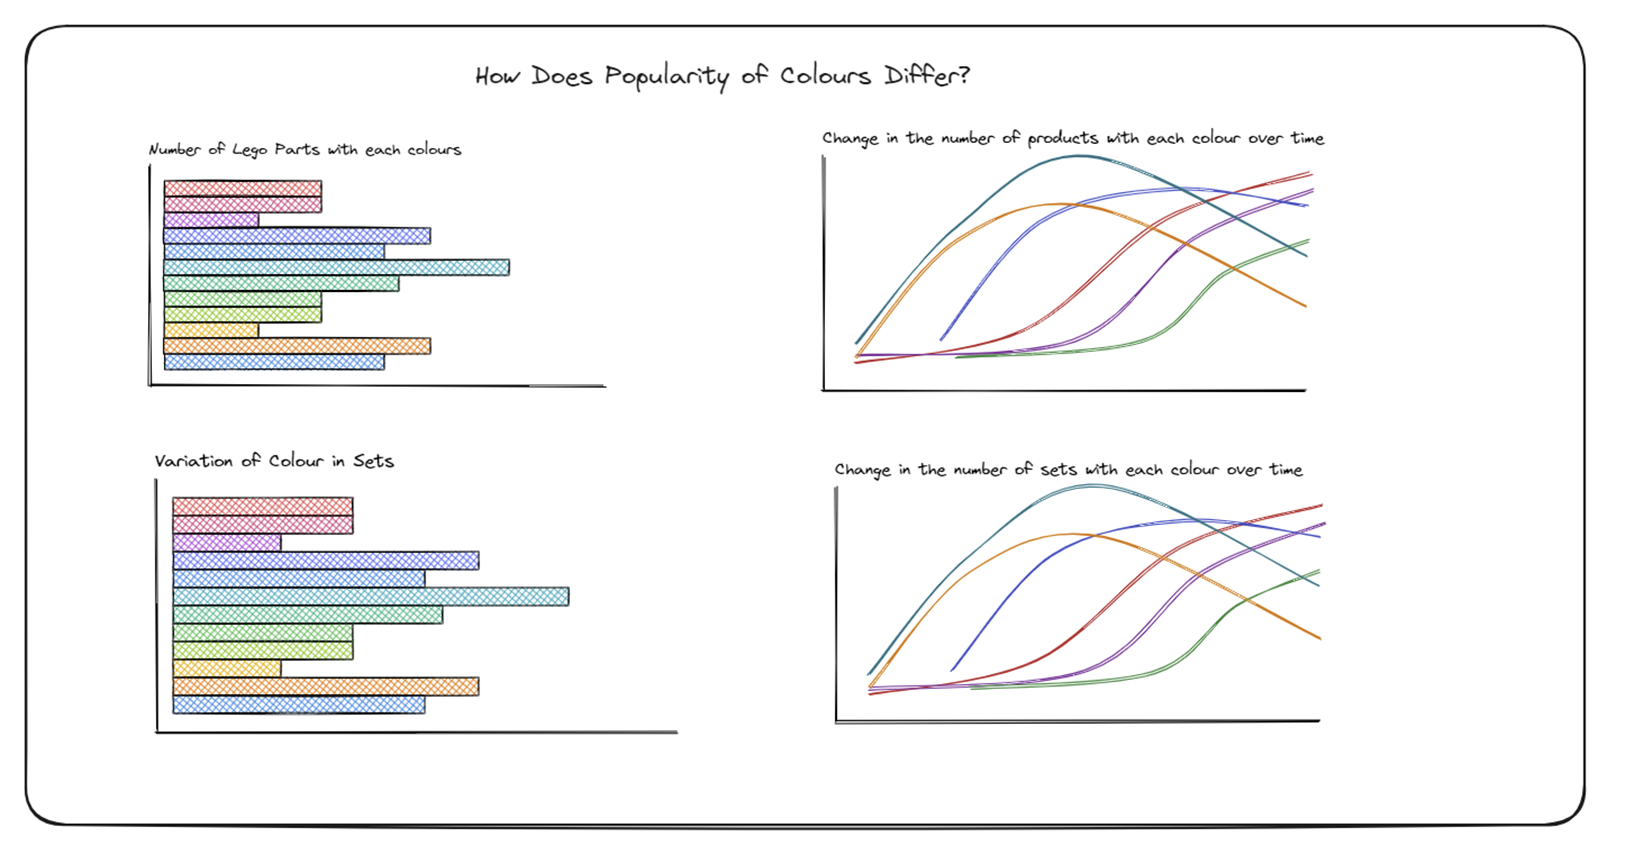
The plan itself was not very detailed however as I spent a sufficient amount of time discovering the data, I was able to work quickly on Power Bi.
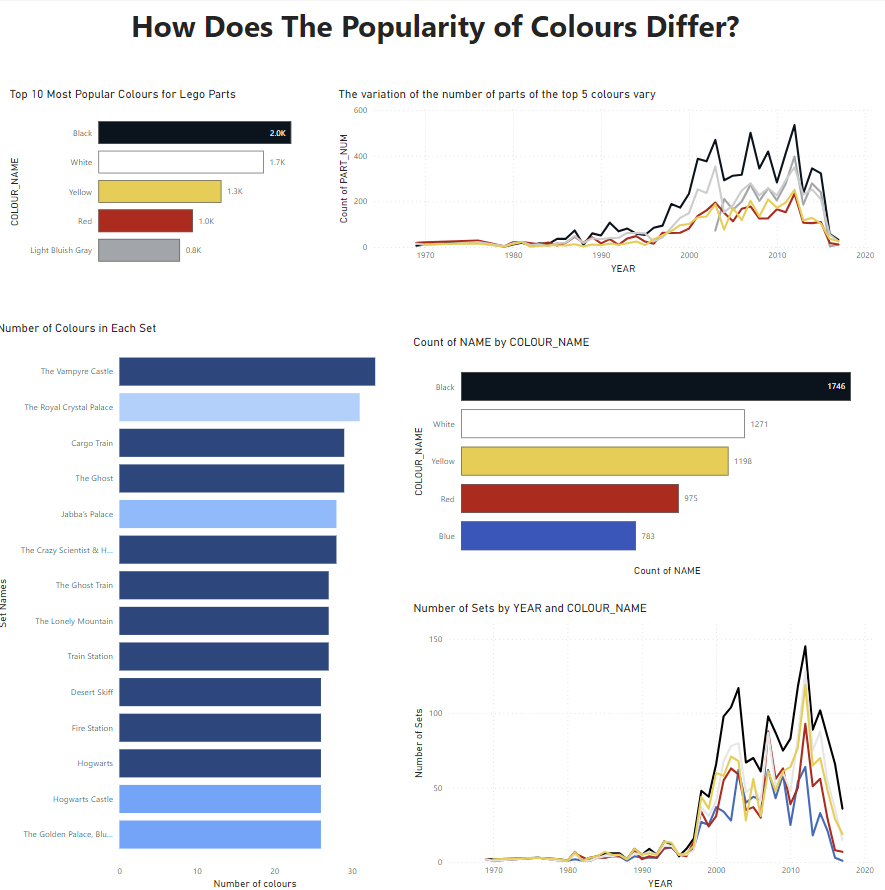
I found the short time allowance difficult as did not have a lot of time to format. Unlike my previous presentations, I did not have time to practice my presentation. Overall I found the data very interesting and with more time it will be interest to delve deeper into other sheets I did not use.