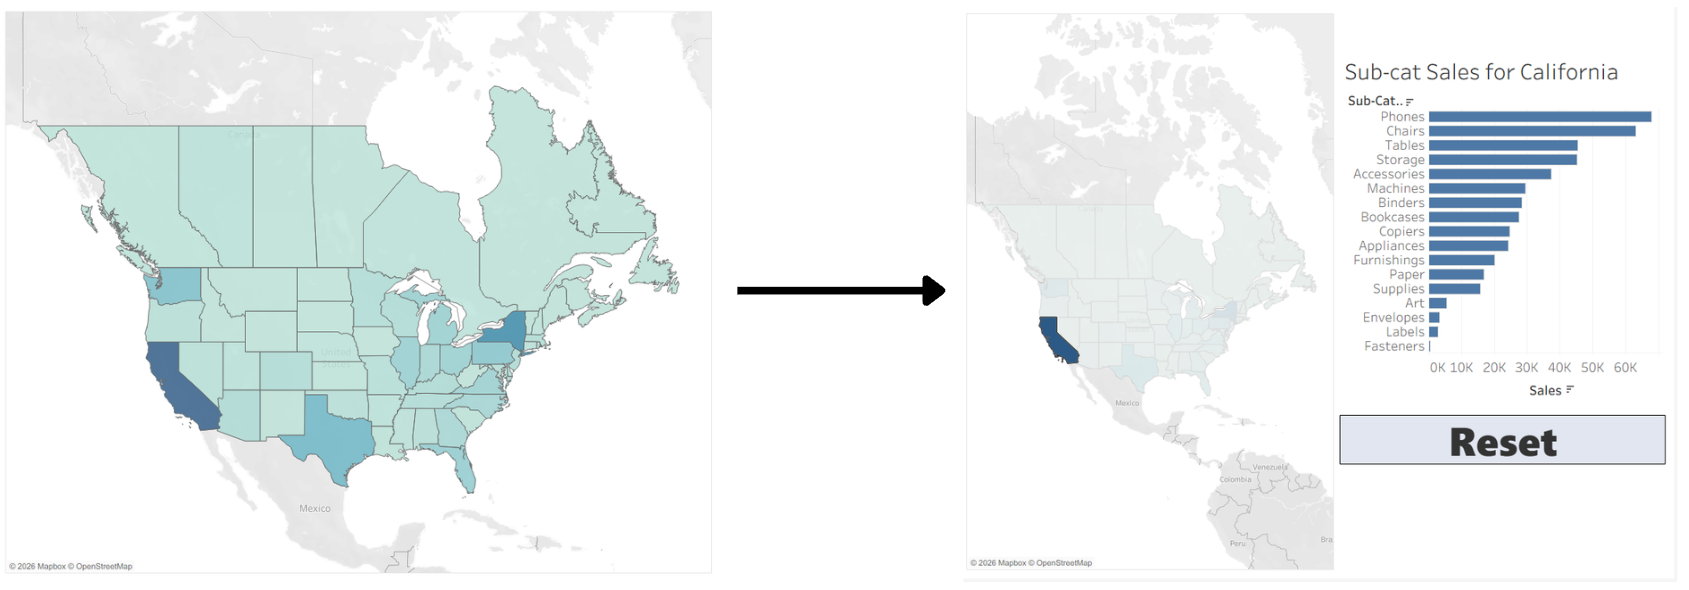
Dynamic Zone Visibility is a technique in Tableau used to customize views by controlling which sheets or containers are displayed. This can be achieved through parameter controls or by linking parameter actions to charts. Here is a step-by-step example of how to build a dynamic sidebar that appears with the click of a map using Sample Superstore data.
1.Create Your Sheets (3)
- Sheet 1: A map showing Sales by State, which will be my toggle for opening the side bar (We will set this up in step 3).
- Sheet 2: A bar chart showing Sub-category Sales.
- Sheet 3: Just a blank sheet for now, this will be my reset button.
2.Create Your Calculation and Parameter
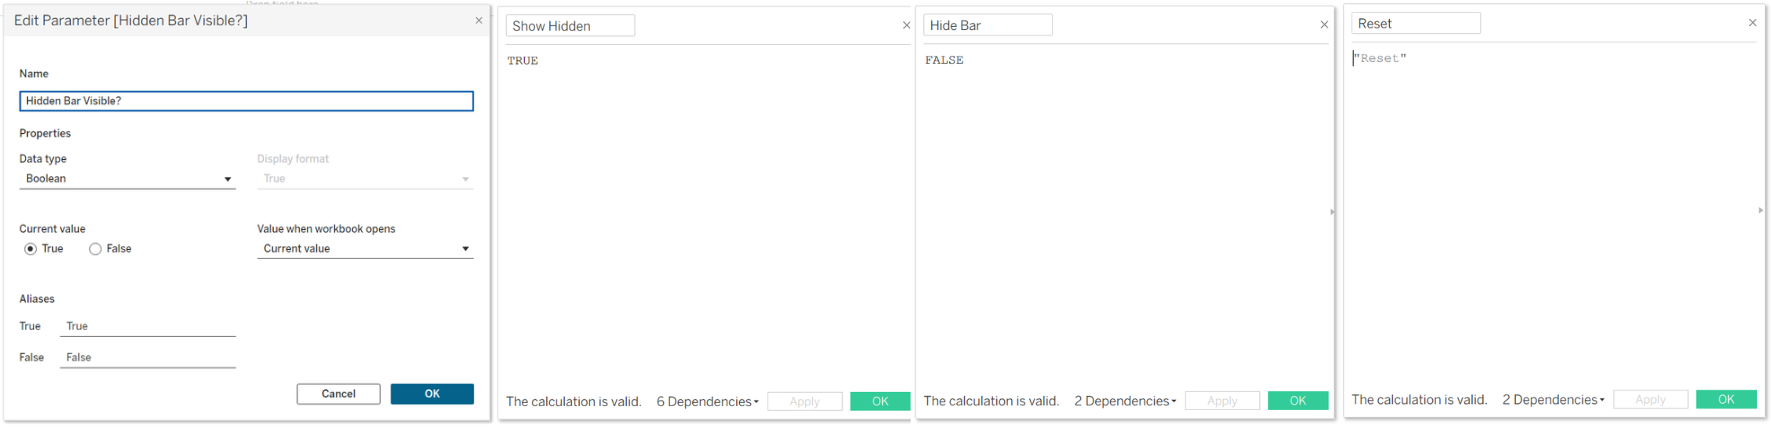
- Boolean Parameter: Create a parameter
Hidden Bar Visible?with a Boolean data type (True/False). - Calculated Field:
- 1:
Show Hiddenwith value set toTrue - 2:
Hide Barwith value set toFalse - 3:
Resetwith a value set as a string - "Reset"
- 1:
3.Add Calc Field to Sheet 1
- Sheet 1: Add your
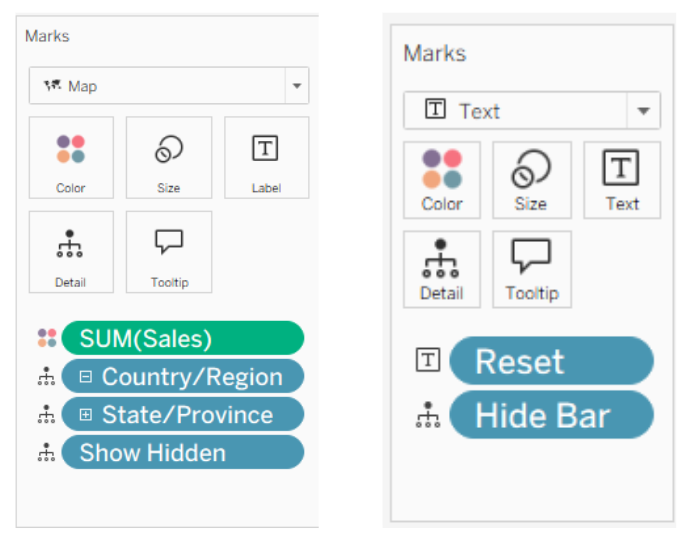
Show Hiddencalculated field to detail on the marks tab. - Sheet 2: Nothing is needed here, functionality is added in our dashboard view.
- Sheet 3: Add your
Hide Barcalculated field to detail andResetto text on the marks tab (you will need to hide your title on the dashboard view).
4.Build Your Basic Dashboard
- Add your three sheets to your dashboard, I have used a container to wrap my bar chart and reset button sheets. Everything that you want hidden should go into this container.
- Important note: make sure all formatting of containers is done before the next steps and once your container is dynamic it can become much harder to format.
5.Add Dynamic Zone Visibility to Your Container/Sheet
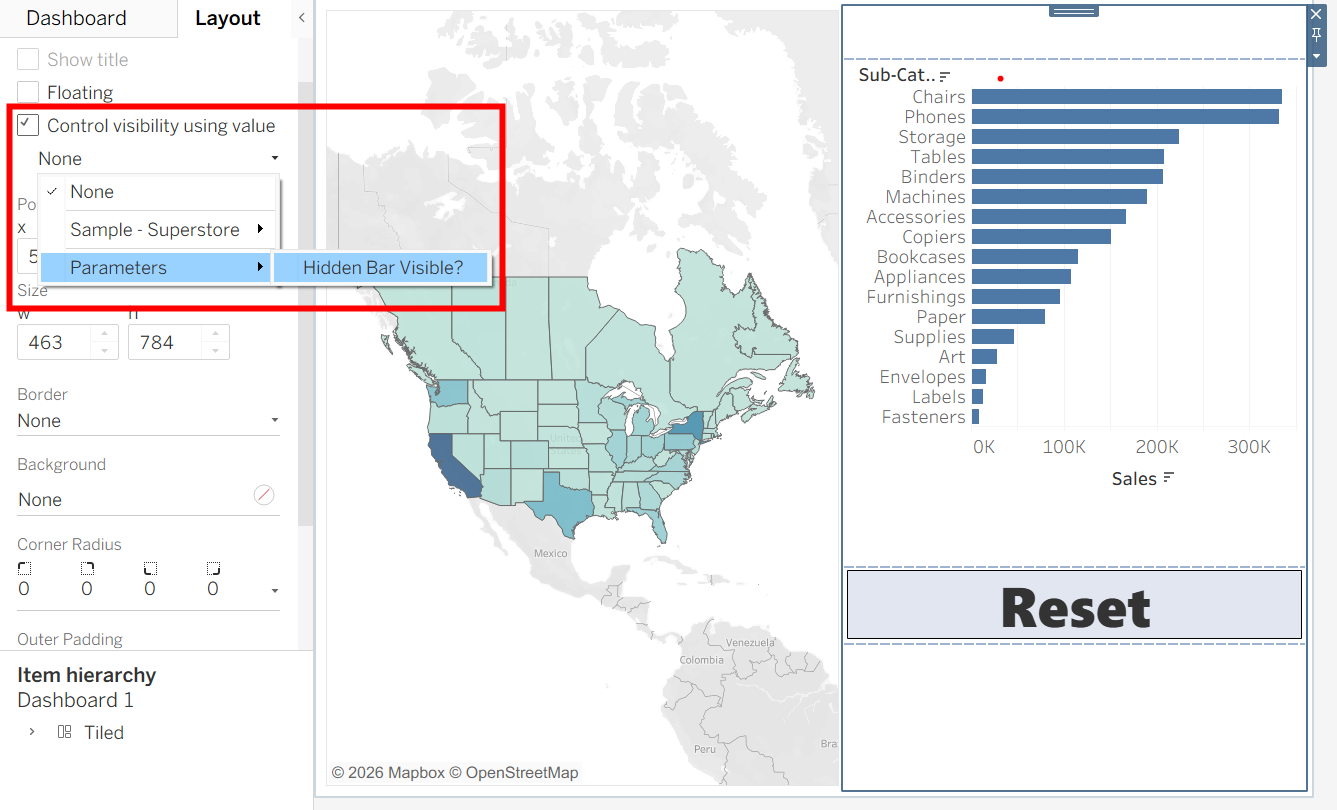
- Select the container (or sheet) you want to be hidden and open layout tab on the left.
- Tick the 'Control visibility using value' box .
- Then select your
Hidden Bar Visible?parameter.
6.Add the Interactivity
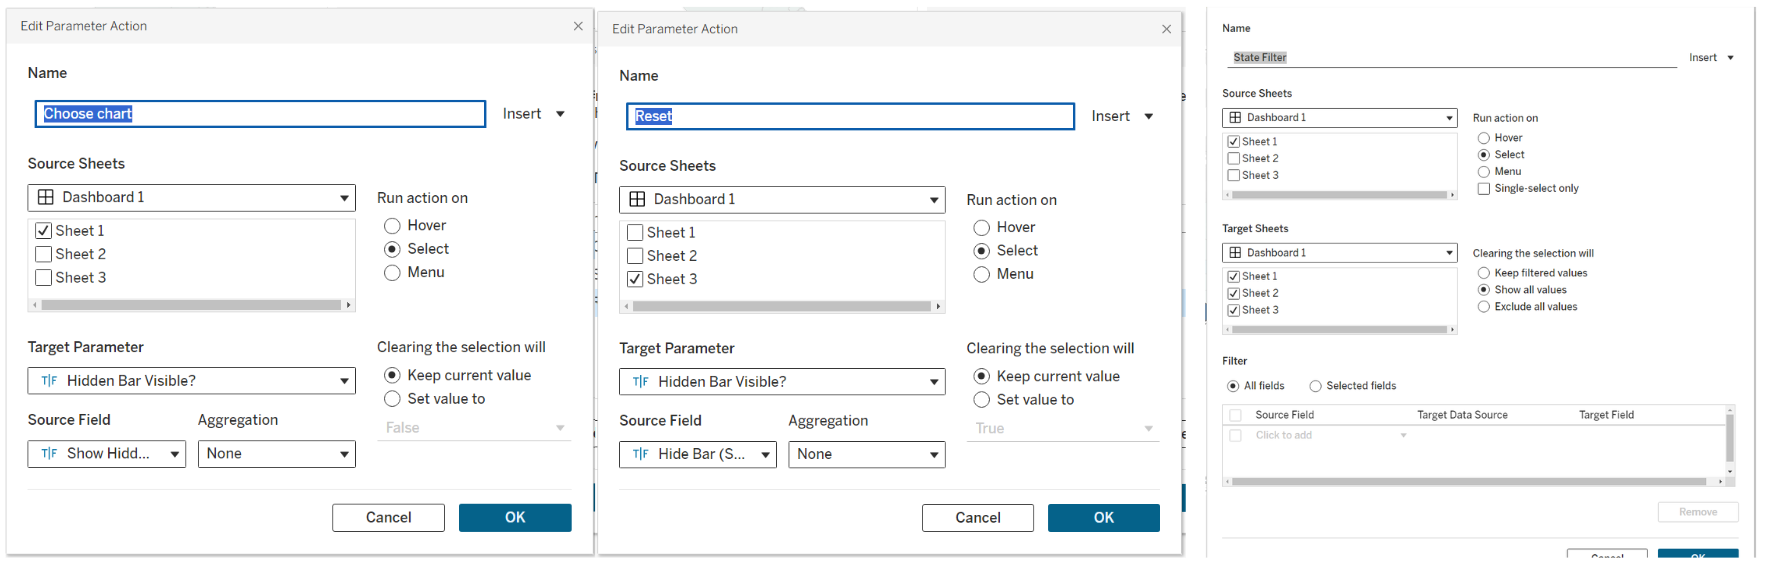
- In Dashboard>Actions create a new Parameter action called
Choose Chart:- Source Sheet:
Sheet 1on 'Select'. - Target Parameter: Choose your
Hidden Bar Visible?parameter. - Source Field: Choose you
Show Hiddencalculated field.
- Source Sheet:
- Create another Parameter action called
Reset:- Source Sheet:
Sheet 3on 'Select'. - Target Parameter: Choose your
Hidden Bar Visible?parameter. - Source Field: Choose you
Hide Barcalculated field.
- Source Sheet:
- Create a new Filter action called
State Filter:- Source Sheet:
Sheet 1on 'Select'. - Target Sheets:
Sheet 2on 'Select'.
- Source Sheet:
How it Works
Clicking on any section of the map (Sheet 1) triggers the parameter action Choose chart, setting Hidden Bar Visible? to the value of the Source Field, True, making the container with our bar chart and reset button appear while simultaneously filtering it to the selected State.
When clicking our Reset button this triggers the Reset parameter action this time, setting Hidden Bar Visible to False, hiding the container once again.