


Order of Operations:
Firstly, what is the Order of Operations in Tableau? It is the order in which tableau does things to your data before it shows up on your screen.
Therefore, to understand how Tableau works it is useful to understand the order in which it manipulates and filters your view.
Understanding the order of operations allows you to use filters and level of detail calculations more effectively, as well as helping explain why Tableau sometimes does not produce the view you expect.
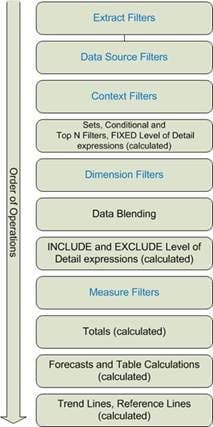
The Order of Operations:
1) Extract and data source filters
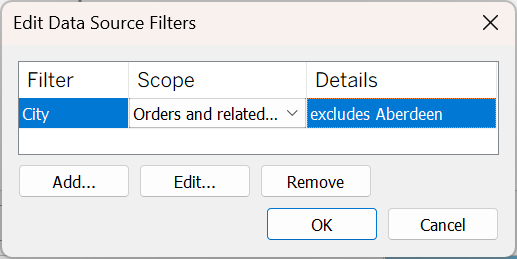
Extract and data source filters are applied at the very start of Tableau’s order of operations, before any worksheets are created. They control which rows of data are available to Tableau at all.
These filters are set on the Data Source page, not within a worksheet, and remove data before any grouping, aggregation, or calculations take place. This makes them useful when you want to permanently exclude data you know you will not need, such as certain regions, time periods, or record types, and can also help improve performance on large datasets.
Because they run so early, nothing later in Tableau can override them. If data is filtered out at this stage, it cannot be brought back by worksheet filters or calculations. This is why a view can appear to be missing data even when no filters are visible in the worksheet.
Filtering right at the data source gets rid of the measure at the start of the pipeline, but you will need to be cautious with this as you cannot bring it back later.
2) Context Filters
Context filters are regular dimension filters that have been moved earlier in the order of operations. You apply them by right-clicking a dimension filter and selecting Add to Context.
Once a filter is in context, it is evaluated before other dimension filters and calculations. This allows you to control which data later filters and calculations are based on, rather than simply hiding values at the end.
Context filters only work with discrete fields, such as categories, regions, or dates set as discrete. In the Filters pane they are shown in grey, which makes them easy to distinguish from standard dimension filters.
They are particularly useful when you need other filters, such as Top ‘n’ filters or calculations, to operate on a specific subset of the data.
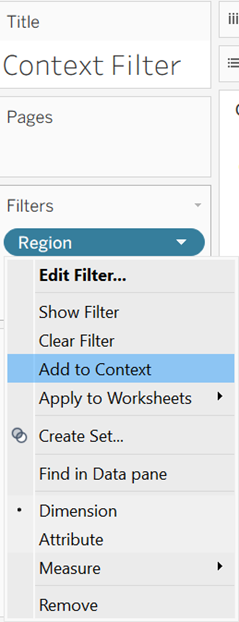
“Add to Context” tells Tableau to apply this filter first, so everything else runs on the filtered data.
Sets, Conditional and Top N Filters, Fixed Level of Detail Calculations
At this stage, Tableau evaluates sets, conditional and Top N filters, and FIXED level of detail (LOD) calculations. These all run before standard dimension filters, meaning they are calculated using a less restricted version of the data.
This allows FIXED LOD calculations to return stable, overall values that do not change when dimension filters are applied. This is useful when comparing filtered results to global totals or benchmarks.
If you want a FIXED LOD calculation to be affected by a dimension filter, that filter must be added to context so that it runs earlier. This gives you control over whether a calculation represents a global value or a filtered one.
Dimension vs Context filter LOD’s
Conditional and Top N filters are configured within dimension filters, but they are evaluated slightly earlier than standard dimension filters in the order of operations. This means they can behave in unexpected ways when combined with other filters.
For example, a Top N filter will normally calculate the top values using the full dataset, even if another dimension filter is applied in the view. This can lead to situations where the “top” items are not actually the top within the filtered subset.
By adding the dimension filter to context, you force Tableau to apply that filter first. The Top N filter then runs on the filtered data instead, which can change which values appear in the view.
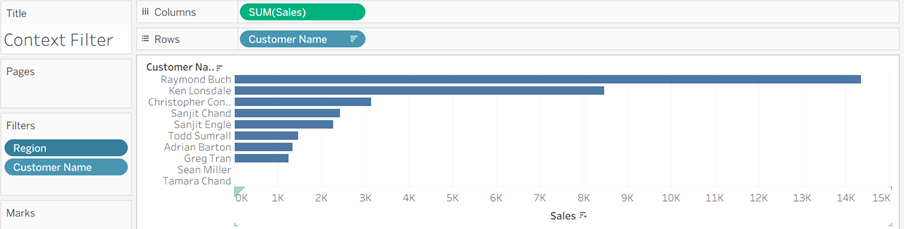
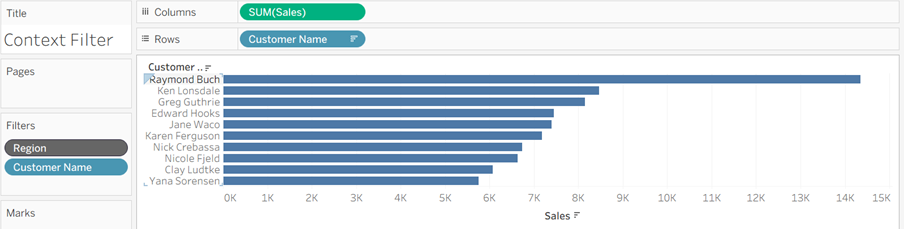
Filtering Region at the context level applies it earlier in the pipeline, which allows the Top 10 customers to be calculated within a specific state rather than across all states.
Dimension Filters:
Dimension filters are the standard filters used to include or exclude discrete values, such as categories, regions, or individual items. They remove entire groups from the view based on the selections you make.
These filters are applied after context filters, sets, Top N filters, and FIXED LOD calculations, which means they do not affect those earlier steps. Instead, they shape what is displayed in the view based on what has already been calculated.
Because of this, the impact of a dimension filter depends on what comes before it in the order of operations, which is why the same filter can behave differently in different situations.
Data Blending:
Data blending occurs after dimension filters have been applied. This means that only the data still present in the view is used when Tableau blends fields from a secondary data source.
As a result, any values removed by dimension filters are not available for blending, which can affect what appears from the secondary dataset. This is important to keep in mind when combining data sources, as the order of operations can influence whether related data is included or excluded.
Include and Exclude Level of Detail Calculations
INCLUDE and EXCLUDE level of detail calculations allow you to adjust the level of detail used in a calculation by adding or removing specific dimensions. INCLUDE adds dimensions into the calculation, while EXCLUDE removes them.
Unlike FIXED LOD calculations, INCLUDE and EXCLUDE are evaluated later in the order of operations. This means they are affected by dimension filters and reflect the data that remains in the view after filtering.
Because of this, INCLUDE and EXCLUDE calculations often produce results that match standard aggregations when filters are applied, and they do not require context filters in order to respond to dimension filtering.
Measure Filters
Measure filters are used to filter based on aggregated numeric values, such as setting a minimum or maximum for a measure like sales or profit.
They are applied after level of detail calculations and dimension filters, which means they do not affect how values are calculated, only which results are displayed. For this reason, measure filters are typically used to hide outliers or focus on a specific range of values rather than to control underlying calculations.
Totals, Forecasts and Table Calculations, Trend Lines and Reference Lines
Totals are calculated within the view after filtering and aggregation have already taken place. They summarise the values that are currently visible rather than the underlying raw data.
Table calculations and forecasts are also computed at this stage. These operate on the structure of the view itself, using the marks that remain after all filters and calculations have been applied.
Finally, trend lines and reference lines are added to the view based on the results already displayed. They do not influence the data or calculations, but provide additional analytical context on top of the final visualisation.
Summary
Tableau’s order of operations explains the sequence in which filters, calculations, and visual elements are applied to your data. Understanding this sequence makes it easier to predict how different elements will interact, and to diagnose unexpected results when building views.
By knowing which steps happen early and which happen later, you can place filters and calculations more deliberately, ensuring that your analysis reflects exactly what you intend to show.