Week 3 Day 2 of The Data School was our first introduction as a cohort to Power BI. Fortunately I have had some basic experience with Power BI which certainly helped, but there were some cool tips and tricks that I'd never come across before!
The data we learnt from was taken from a Rotten Tomatoes '100 Best Movies on Netflix Ranked by Tomatometer'. This is where PowerBI first blew my mind with the ability to webscrape straight from a website by pasting in the URL. This can be found from the 'get data' tab, and searching web in the search bar. The best part about this is that if the website updates, the final visual will pull any updates through (provided that the website structure is unchanged).

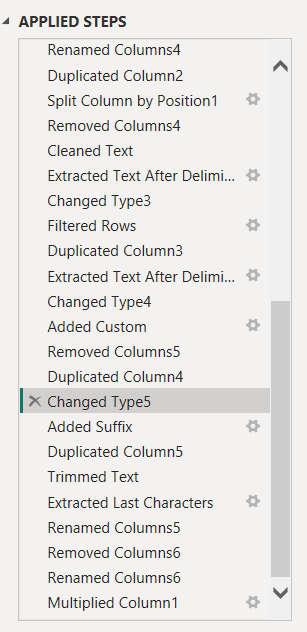
Once getting the data it was then time to use Power Query to prepare it. Some basic steps were needed, such as using the first rows as column headers, removing unnecessary columns.

This threw up the first key tip that I would make sure to follow if I did the task again - RENAME THE STEPS! Otherwise you are left with a jumbled list of steps which would be a nightmare to go back to, definitely don't be like me on that.

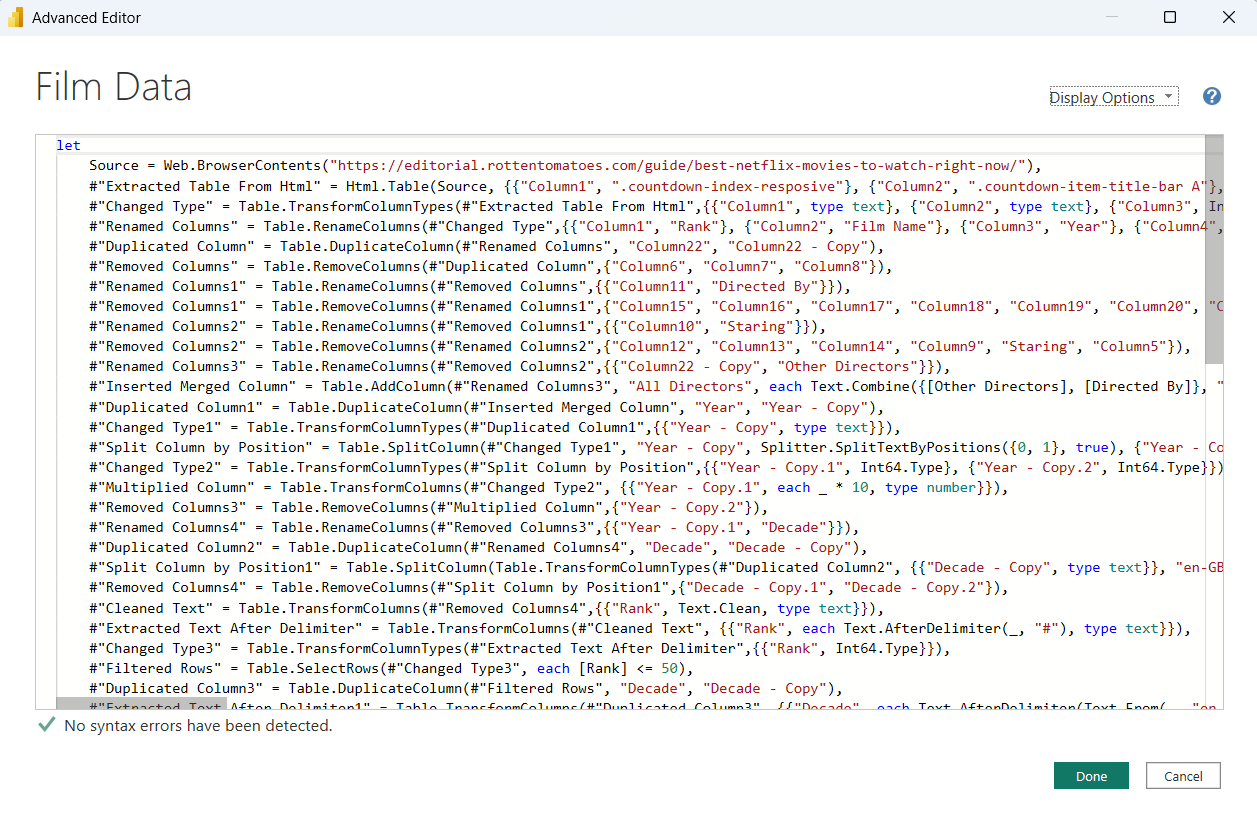
A longer 'coded' version of all these steps can be found in the advanced editor. This can be useful if you want to try and pinpoint errors or send the same dataprep steps to someone who started with the same initial dataset.

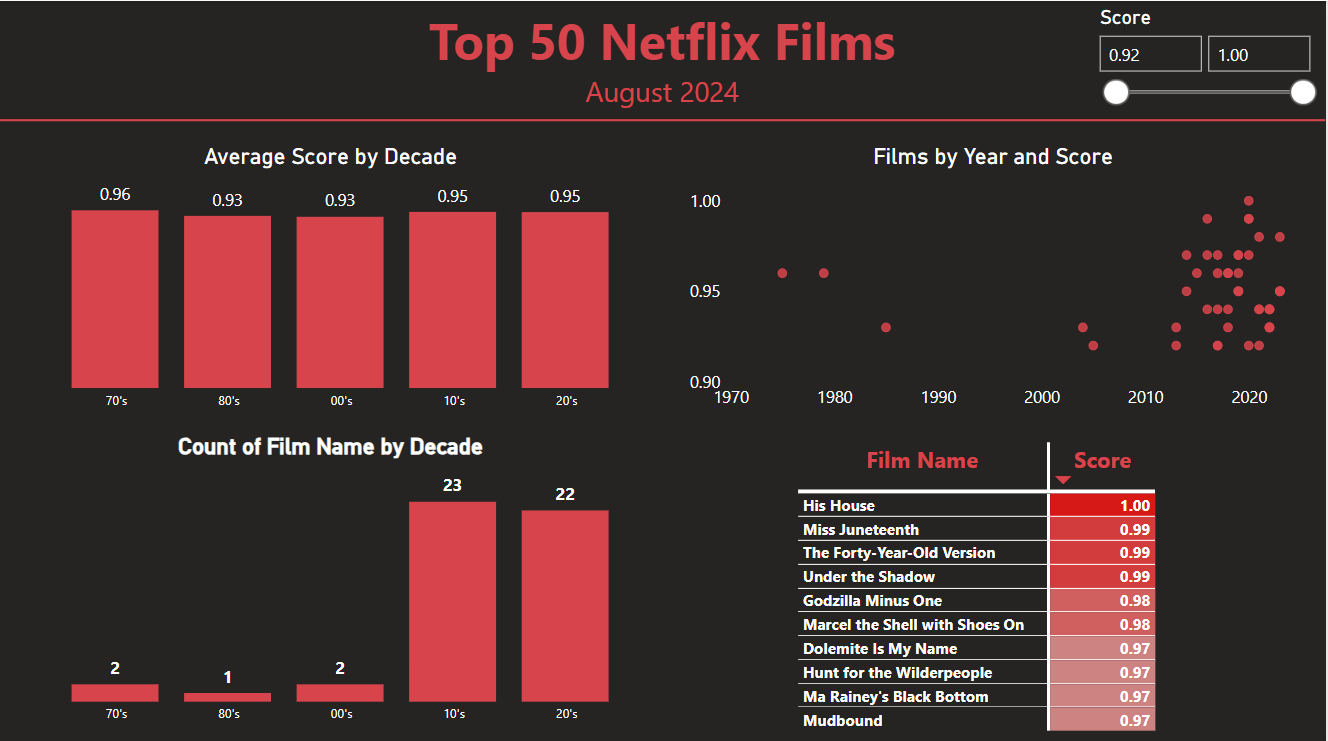
Once all the data prep was done we were then let loose in PowerBI, with the aim to create a dashboard to visualise the data. One advantage for me in PowerBI is that everything is essentially floating, so there is no need to mess around with containers! I kept to the black and red Netflix theme, and tried to create a colourcoded/ heatmap table in an attempt to make sure not everything was a trusty bar chart! My final dashboard can be seen below.

While the dashboard is relatively basic, it will be great to come back to in order to see progression in the coming weeks!
