Today we spend training ourselves how to answer questions with data. This isn't a skill that can be learned by simply reading a textbook (albeit it does help at times), but mainly by doing and learning from each other.
Therefore, we worked on developing an user story around New York Rat Sightings data, where we could decide who it would be for and what it would be used for.
The goal was to stick to a simple line of questioning:
As a (put name here), when I (put act/work here), I want to be able to (put your desired data driven outcomes here).
I went for the following:
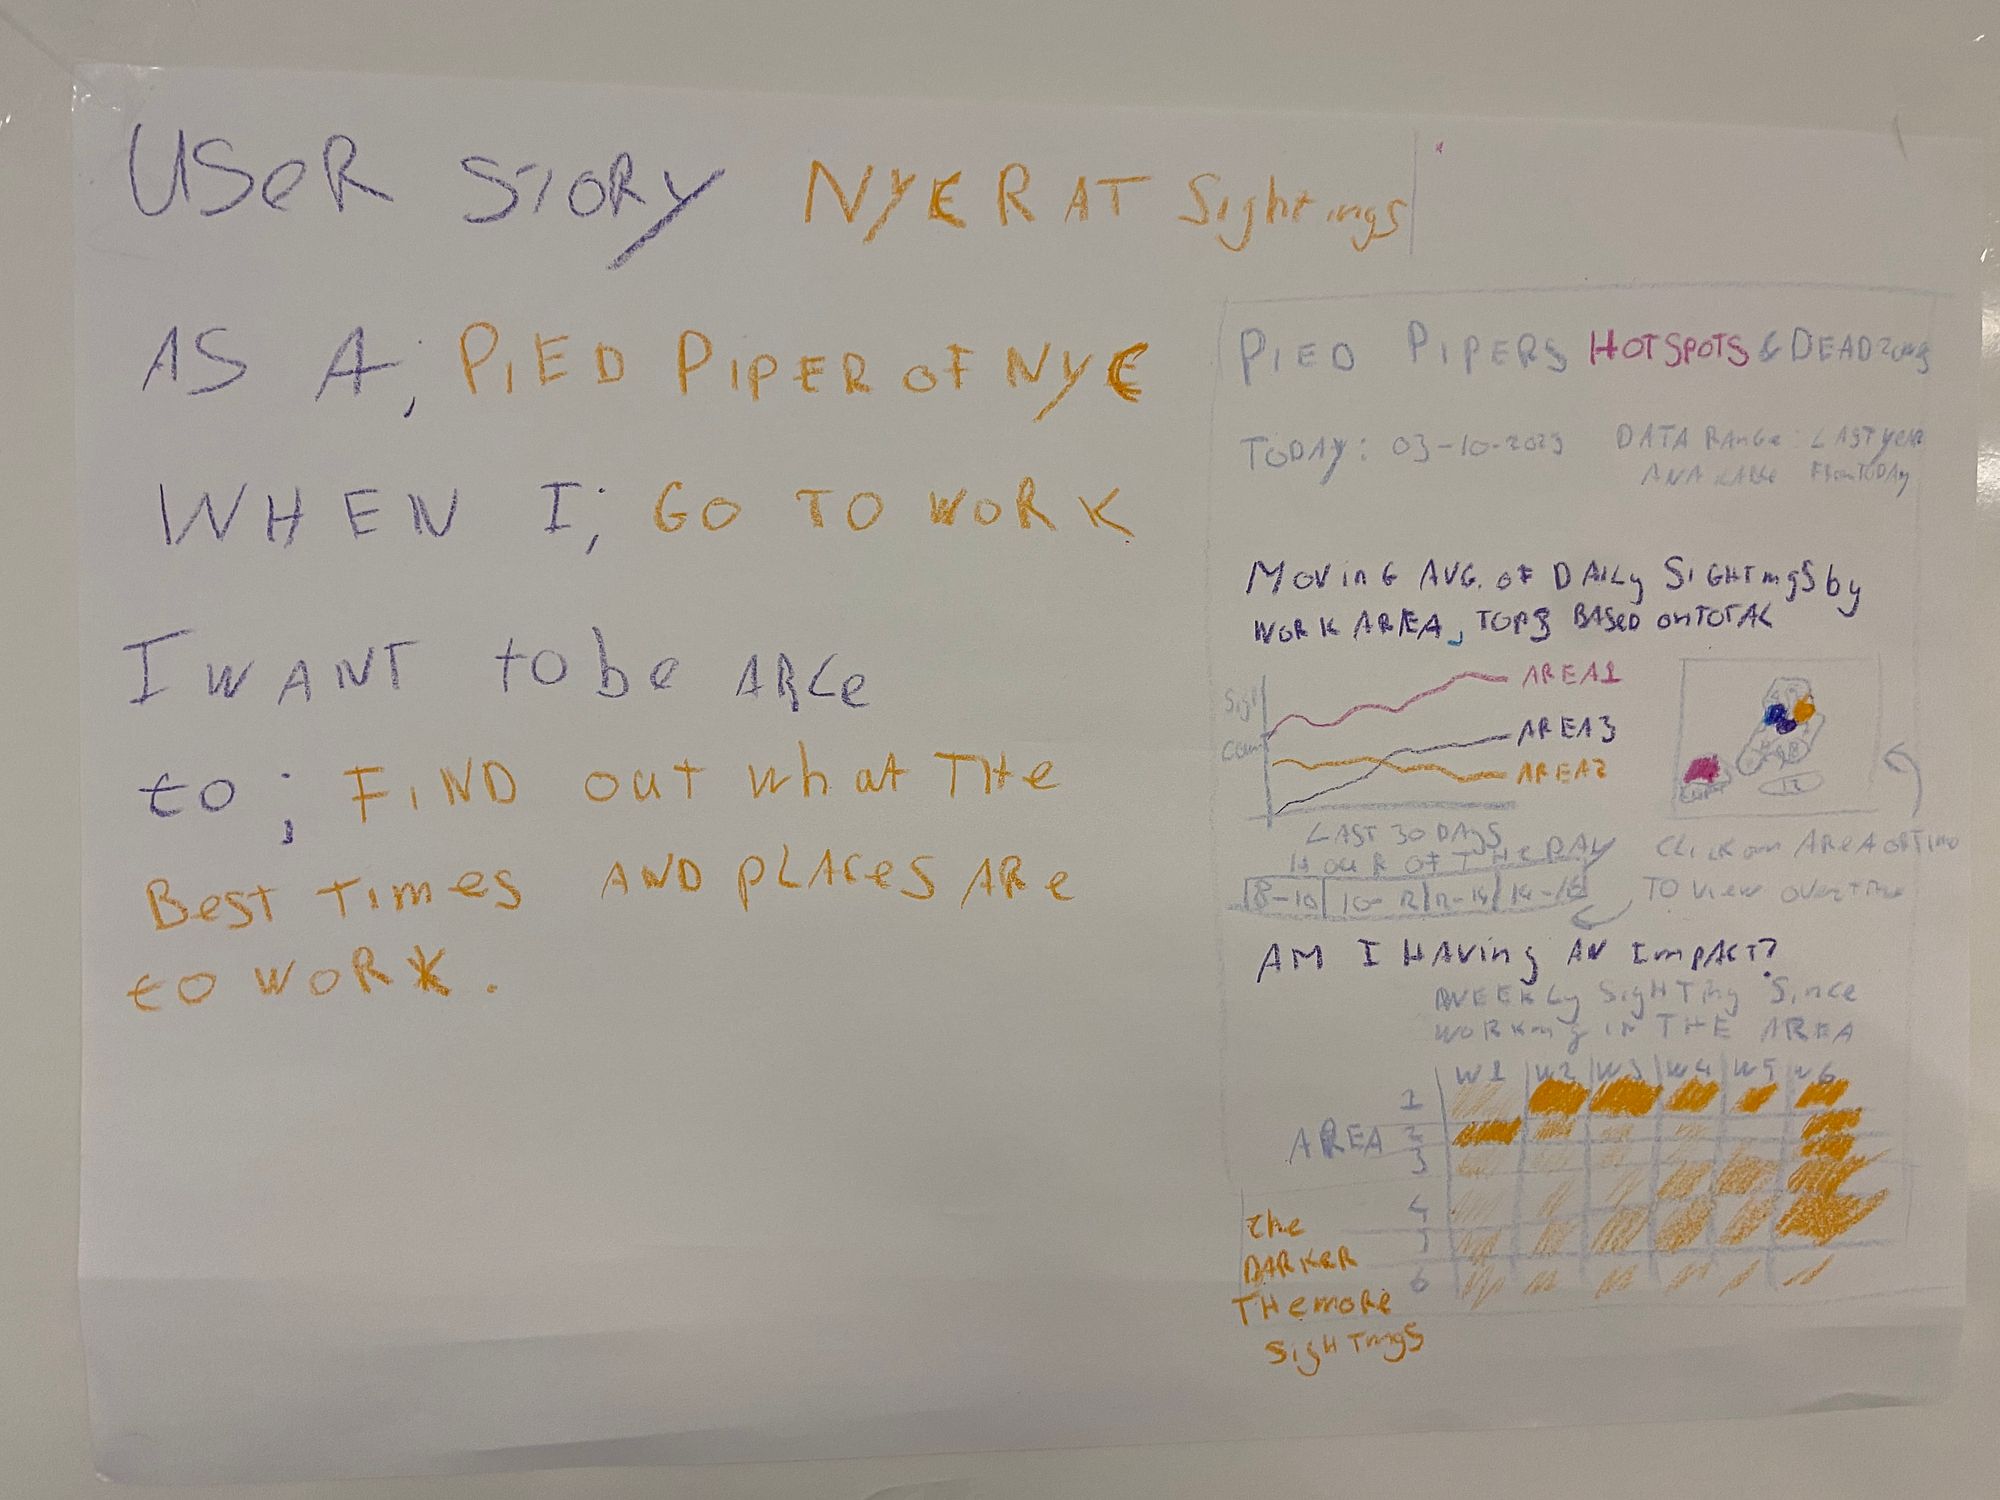
As a Pied Piper of New York City, when I go to work, I want to be able to find out what the best times and places are to work.
Starting with this outset, I had to make some assumptions on how much of an area an Pied Piper could cover in a set amount of time (in a real life scenario we would ask our client this). So this time I went for New York City and divided it up in rough areas and 2 hour time slots between 8:00 and 16:00
By investigating the last 30 days of data (moving averages of sightings) the top 3 areas would show on the divided up map. If we want to investigate what those sightings looked like in 2 hour time slots we would click on the desired time shape.
To wrap it up we also track the impact we make as Pied pipers by normalizing the rat sightings of area's to a starting week (the week after we worked in an area), so we can track how long it takes for rat sightings to go up again in an area.
See a photo of my sketch and user story below.

This remains one of my favourite exercises to do to hone our data consulting skills.
Creating user stories and sketches allow you to feedback your understanding of the clients needs and will help guide you through the data and visualisation work whilst potentially saving yourself heaps of time by showing this to a client before spending time on the data.
