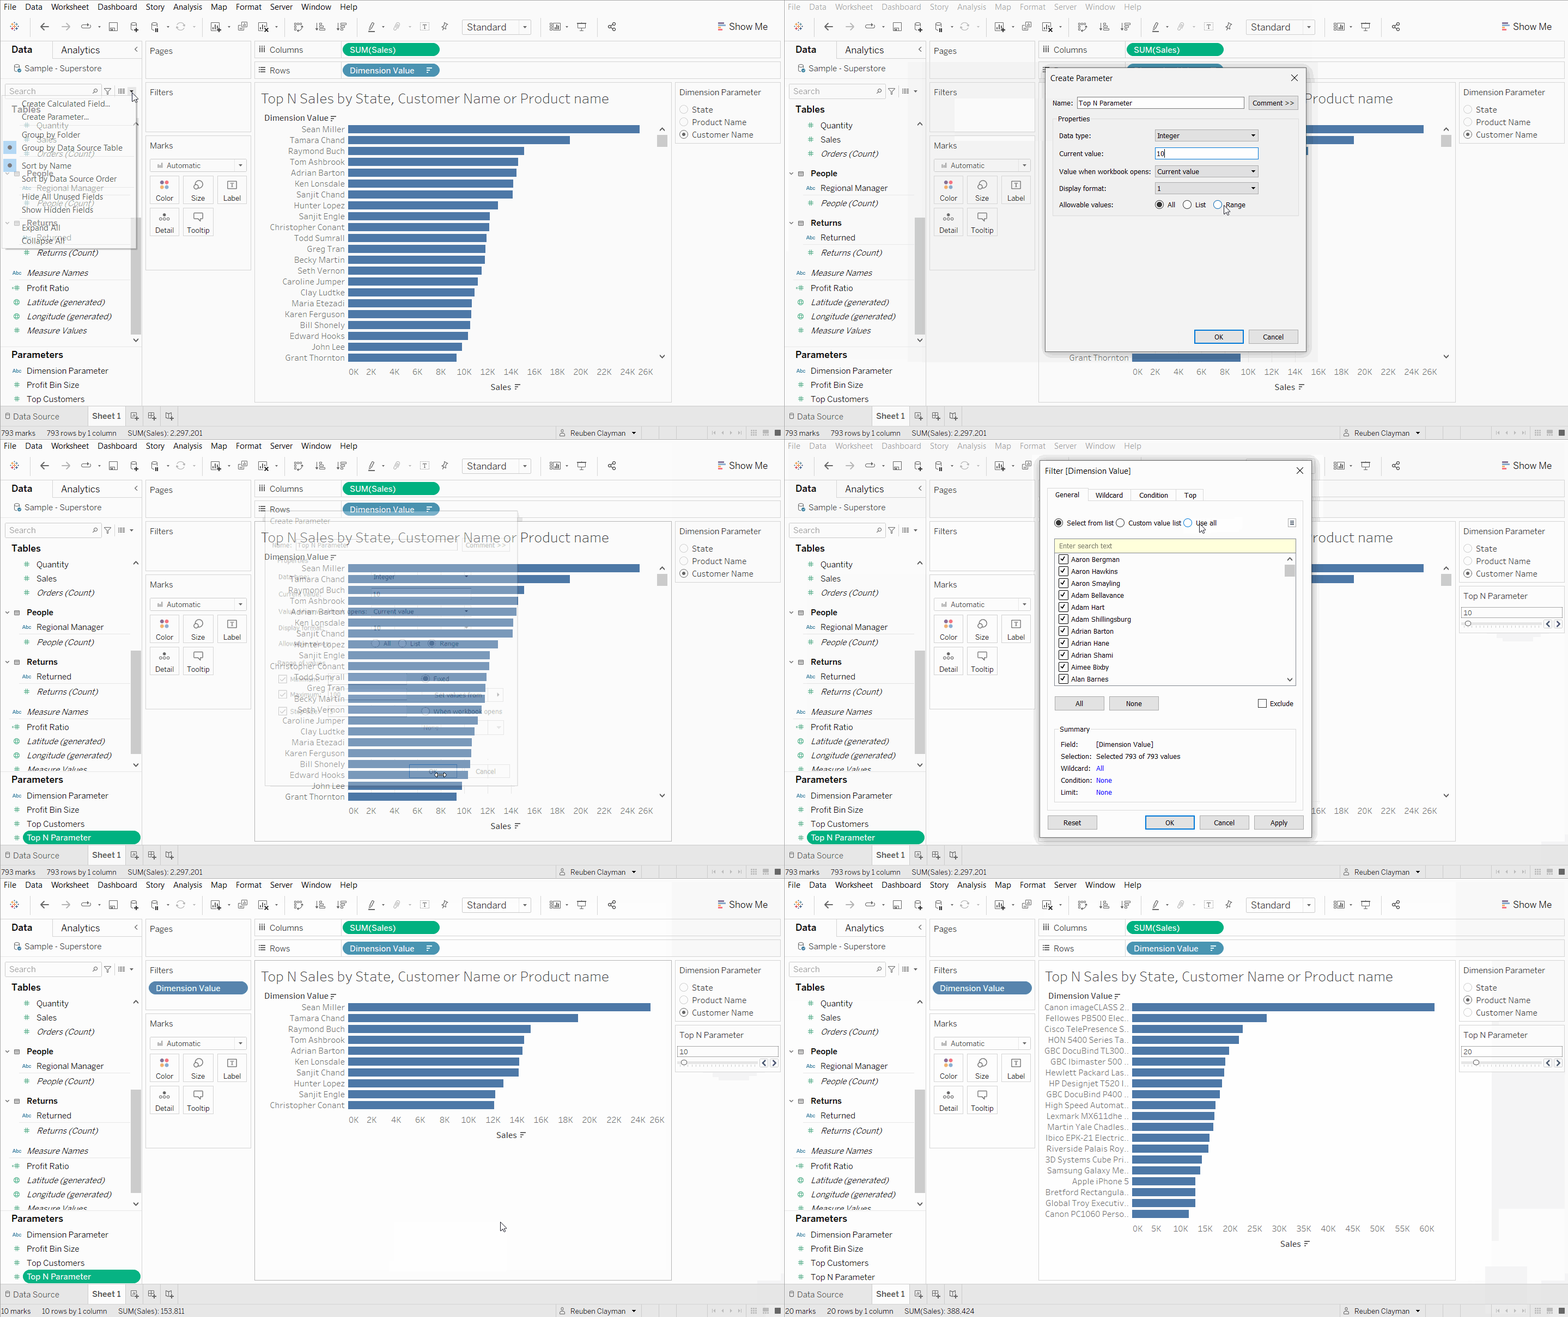
Following on from my previous post I'm going to do a quick tutorial on how to make a Top N Parameter which can be used to filter your charts and graphs by the top specified number of results.
Firstly we need to create the new parameter:
- Select the small arrow next to the search bar and select 'create parameter'
- Change the name so that its easy to keep track of your data pane.
- Change the data type to integer and change the current value.
- change the data to range and select the range you would like to cover e.g 5-100 and also the increments you'd like to increase or decrease the parameter.
Once the parameter is done you will need to add this parameter as a filter for our data.
- On the row shelf right click on the dimension value and select filter
- on the pop up select 'use all values'.
- Select the 'top' tab and in the 'by field' select 'top N parameter'

Make sure to select show parameter on the data pane to make this show up on the right hand side. This is a great tool to only show data that you want to look at and makes it easy to change if you decide to broaden or shrink your ranges.
