Creating paths in tableau is a useful tool to show routes that have been taken and can join together multiple points together.
This blog will go through making a path that uses multiple datapoints using continuous date data.
In todays Tableau lesson we were using global storm data which we narrowed down to the North Atlantic.
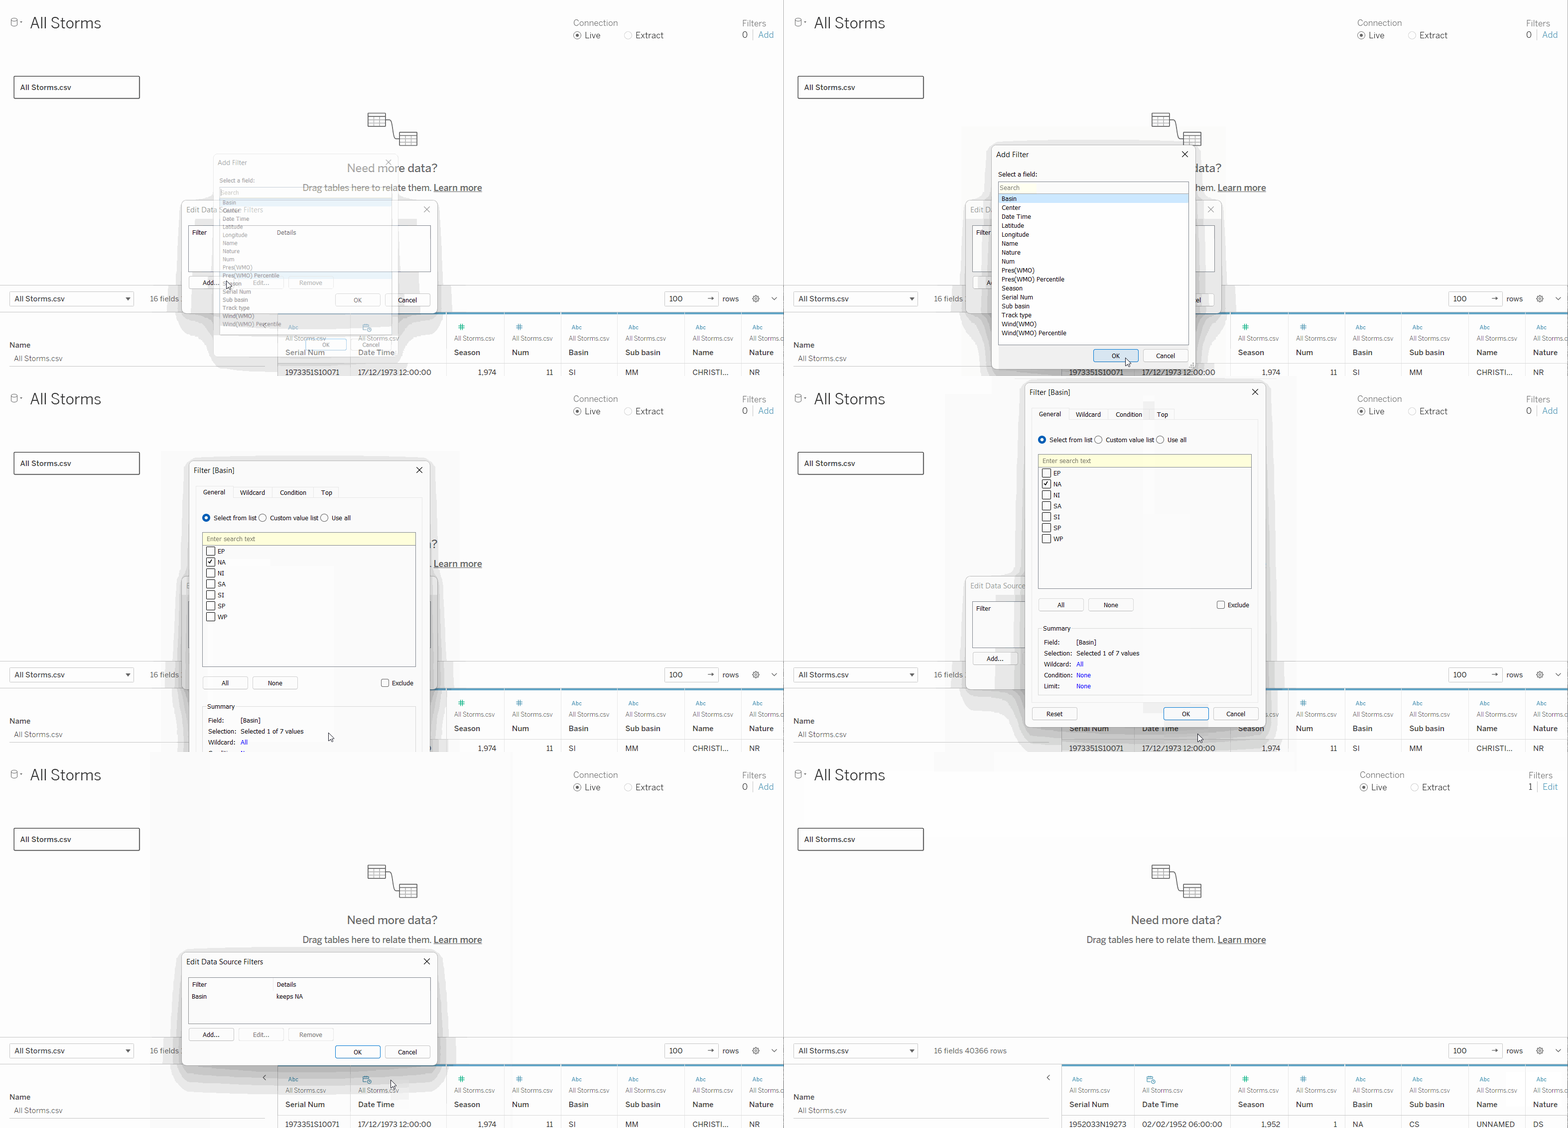
1) Input the storm data into tableau and add filter by selecting top right 'add' select 'Basin' then 'NA' to focus our data on the storms in the North Atlantic.

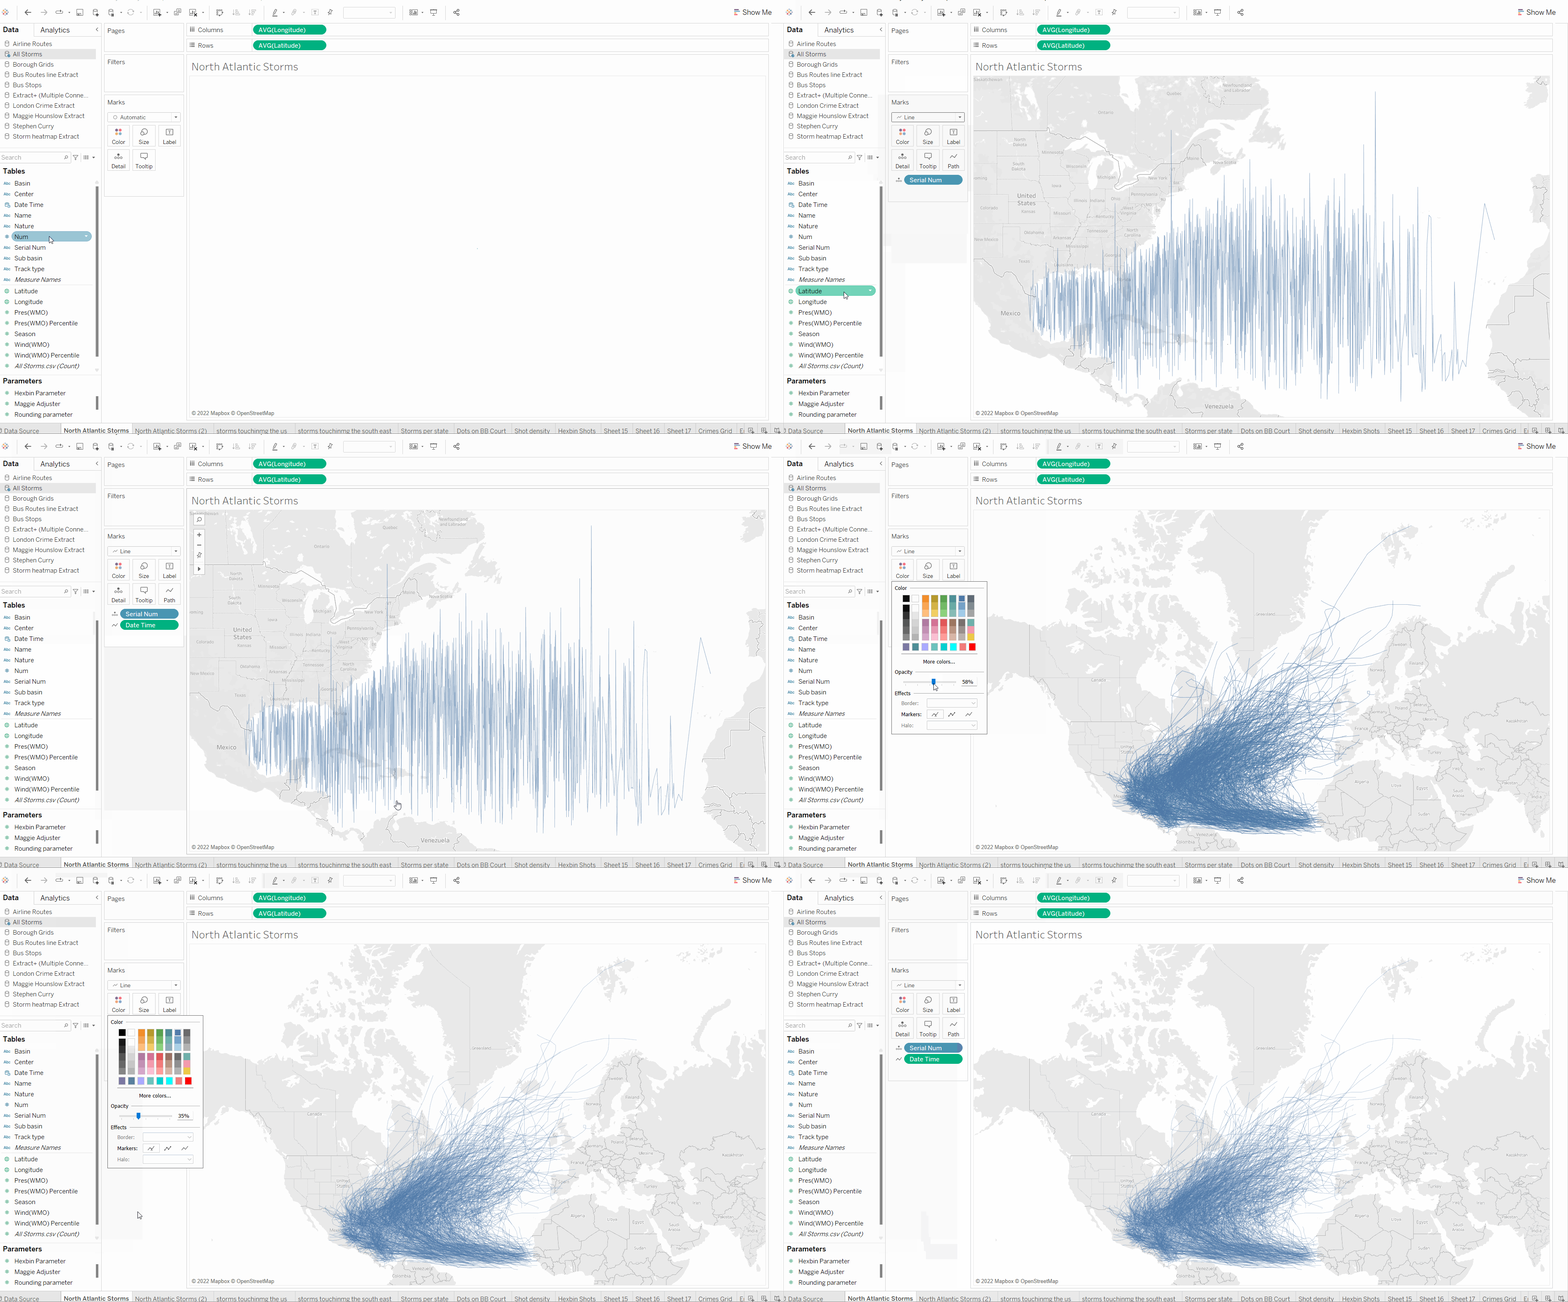
2) open a new worksheet add latitude and longitude to shelf and rows.
3) storms each have a serial number which has multiple points associated it so drag this onto detail.
4) Change the marks type to line
5) In order to make a path we need to know the order the points should be in in this example we have date and time information.
6) Right click and drag date to the path marks card and select continuous date.
7) Reduce the line width and opacity to make it clearer.

