DS 39 are beginning to dive into the behind the scenes of calculations in Tableau. Last week, we looked at calculated fields and how different functions come into play. This week, we started exploring Table calculations and Level of Detail calculations. Most of the time, calculated fields can be applied. However, in certain scenarios, the other two can be efficient and beneficial (depending on what you are analyzing).
Table Calculations
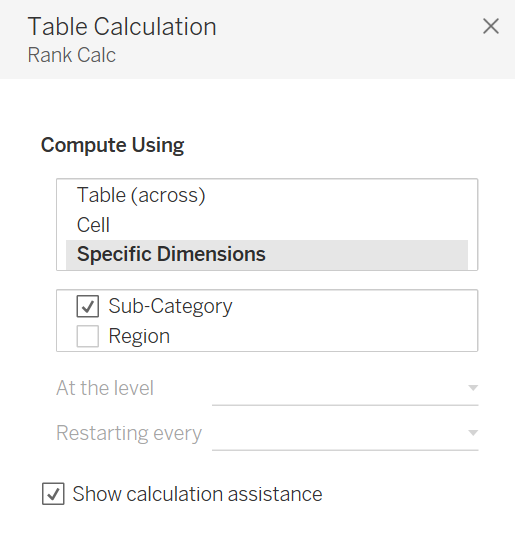
Let's start of with Table calculations. A sentence to remember is "For every unticked calculate table calculation by ticked", I applied this to my rank chart for Makeover Monday so for every region calculate the rank by sub-category. With table calcs, you can add a secondary calculation for moving averages or running calculations. Table calculations are more efficient to use through this window rather than using the "compute using" option due to its lack of control.
Level of Detail Calculations
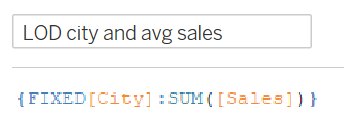
Next we have LOD's. These calculations are used when you want to analyze a lower level of granularity behind the scenes and the view to have a higher level of granularity. For example, if we want to analyze the total average sales per city by region (where city is not in the view). City is not splitting our view and sum of sales is already added to the view, so what do we do? Well, this is where LOD's come in.
Remember the syntax for LOD's: {fixed [Dimension] : aggregation [measure]}
In this case for our example, {fixed[City]:SUM[Sales]}, the average is computed in the marks card. Remember that dimensions (or blue things) are always before the colon.