


Calendar charts are great for identifying key dates within your data, whether it is so mark big days or visualize a trend over a month! This blog post will go through a step by step guide on how to build this chart.
Step 1. Connect to Superstore
We will be using the superstore dataset to create this chart but any dataset with a date field can be used.
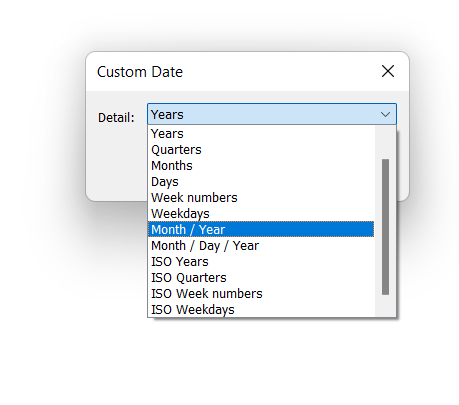
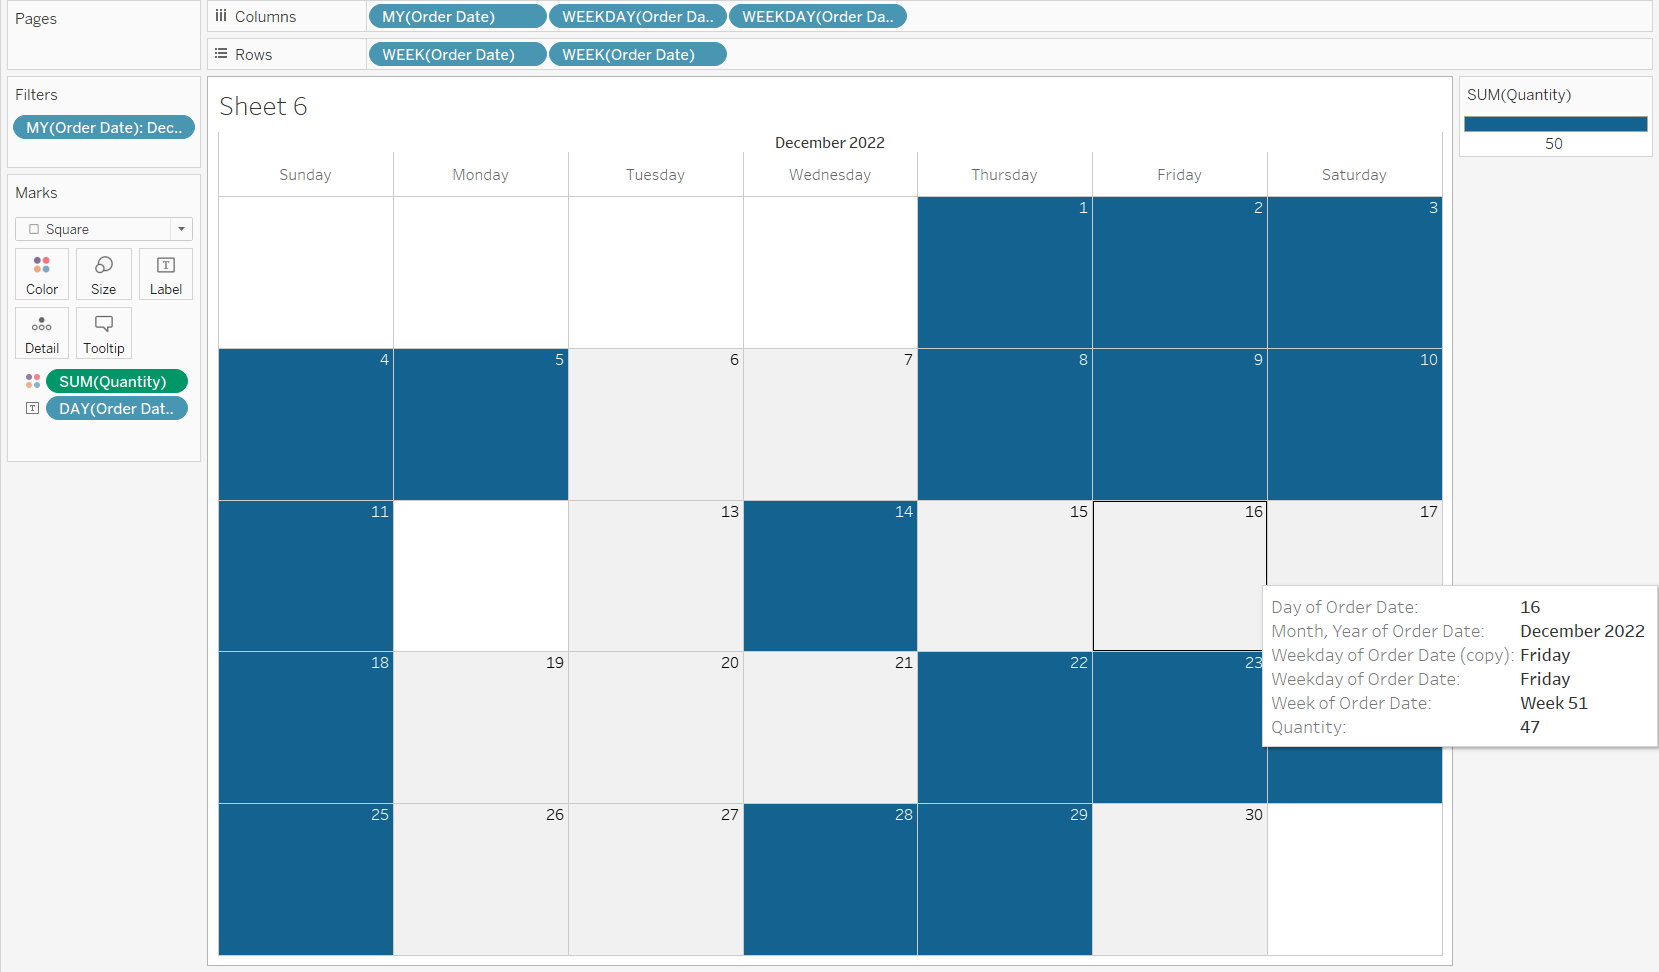
Step 2. Drag order date to columns and change it to month / year
By right clicking on the order date pill, change the date format to month / year using the custom option as a dimension.
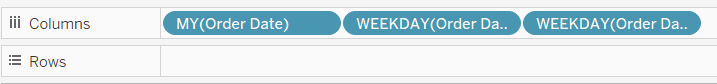
Step 3. Drag order date to columns and change it to weekday
Using the custom option again, change the date format to weekday. You want to create a duplicate of the order date field, drag that to columns and also change the format to weekday. Select the header of the order date copy and hide the header.
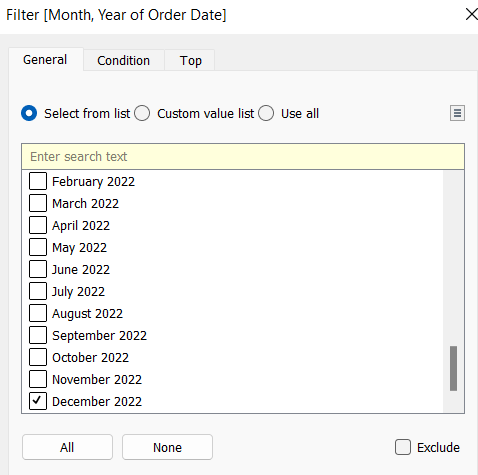
Step 4. Add a month / year filter
Drag order date to the filter pane and change the format to month / year and select any month.
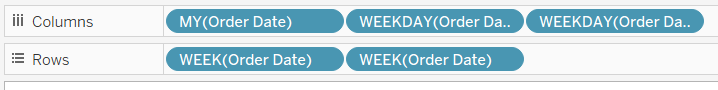
Step 5. Drag order date to rows and change the format to week number
You want to repeat this twice and should have two order date fields in the rows pane, both in the week number format. You can hide the header for the second order date field.
Step 6. Drag order date to the text marks card
Change the date format to day so it resembles the numbers of a calendar - I adjusted the alignment of the text to the top right.
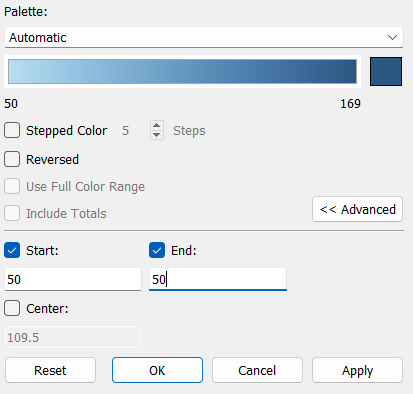
Step 7. Add quantity to color and change the scale
Now that you have your calendar, you can be creative and customize it to show whatever data and insights you may find interesting! To create the calendar chart with quantity, drag quantity to the color marks card and change the start and end. This is to indicate dates with a quantity ordered over 50.
Step 8. Change the chart type
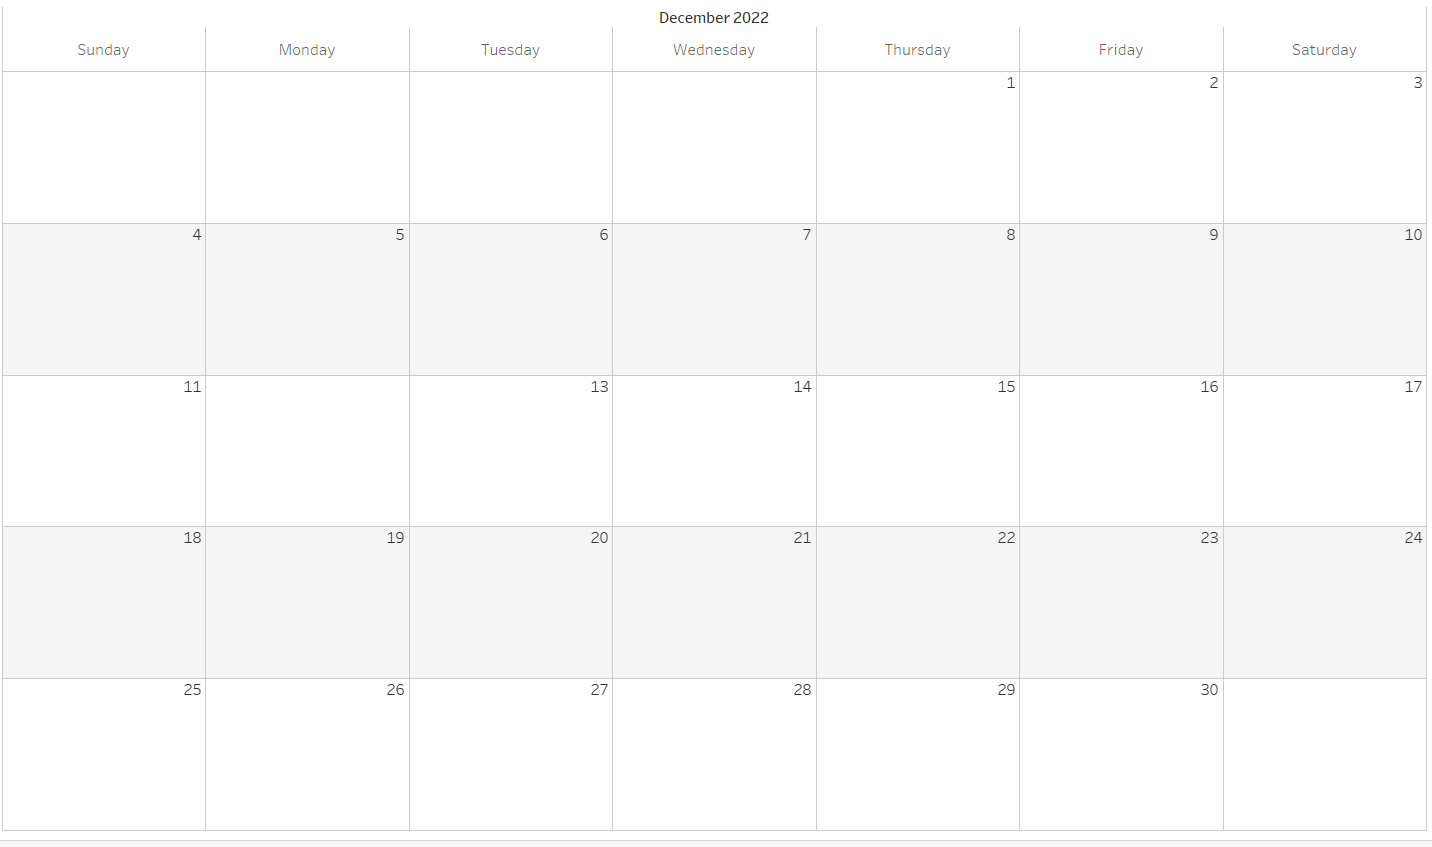
Finally, change the chart type to square and increase the size until the calendar is filled. It should look like the image beneath after following all these steps.
You can place a filter on the dashboard so users can select a month and year for interactivity.
Feel free to make any changes to your liking and reach out on LinkedIn if you have any questions. Good luck building your calendar chart!