


Let’s learn how to make progress bars and add a fun indicator at the end of the bars. This add-on is sure to add a nice visual touch for your end user and their experience with the data analysis.
For this tutorial, I will be using the 2019 NYC School Survey - Student dataset from NYC Open Data. You can find the link to this data set here.

- Import the data and configure the Data Source Canvas.
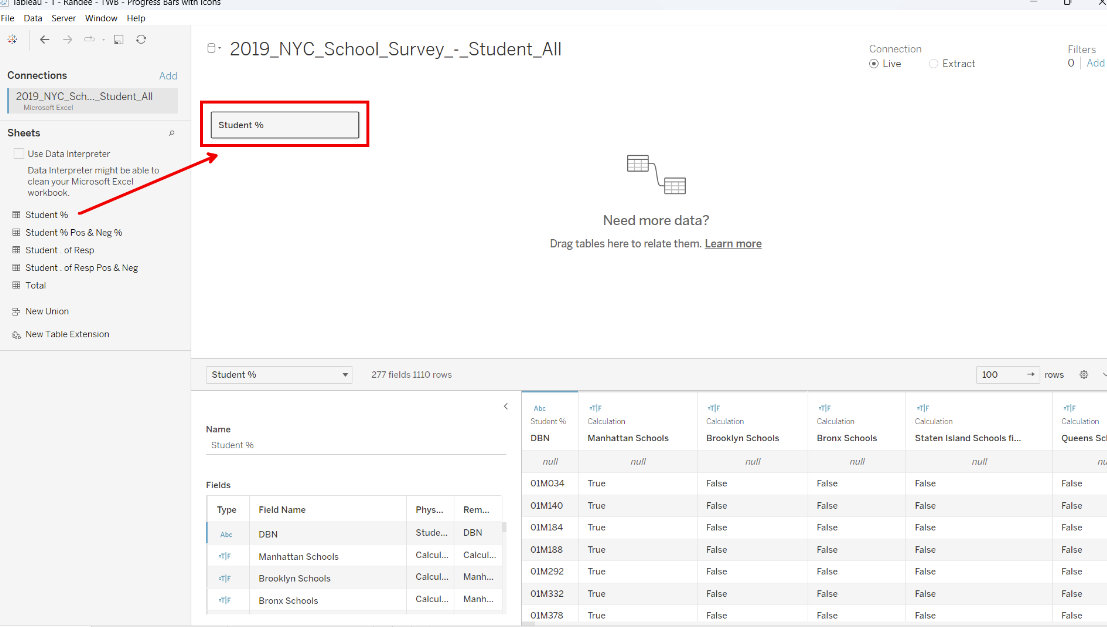
Once you have the data, select the ‘Student %’ sheet and drag and drop it onto the Data Source page canvas. In the preview, we immediately see columns for DBN, SCHOOL NAME, and TOTAL STUDENT RESPONSE RATE. We have many other columns, but we won’t be using them. In addition, this particular sheet contains all of the information that we need.
Visualization Goal: Top 10 Staten Island schools that have the lowest student participation percentage.
- Navigate to a new sheet.
Note: I chose Staten Island because they have the least amount of schools across the five boroughs of New York City and it will be easier for us to work with a more limited scope of data. Once we are done, feel free to mimic the steps that I used for Staten Island and analyze the progress of other NYC schools!
- Use DBN Codes to be able to filter the boroughs.
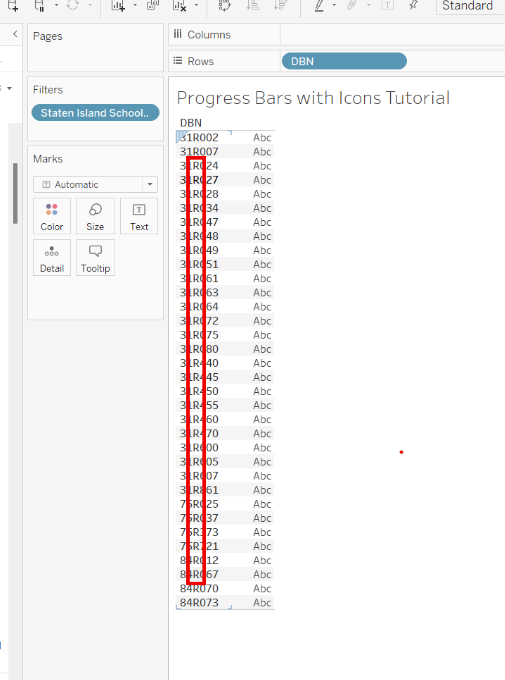
Drop the DBN pill onto the rows shelf. If you are prompted, select “Add All Members”. Now, notice that there are borough indicators embedded in those codes.

- Filter out the Staten Island schools using a calculated field.
Navigate to the data pane. Select the drop-down and choose “Create a Calculated Field…”. Name this calculation STATEN ISLAND SCHOOLS. Use the CONTAINS() function to look within the DBN field for the letter R.

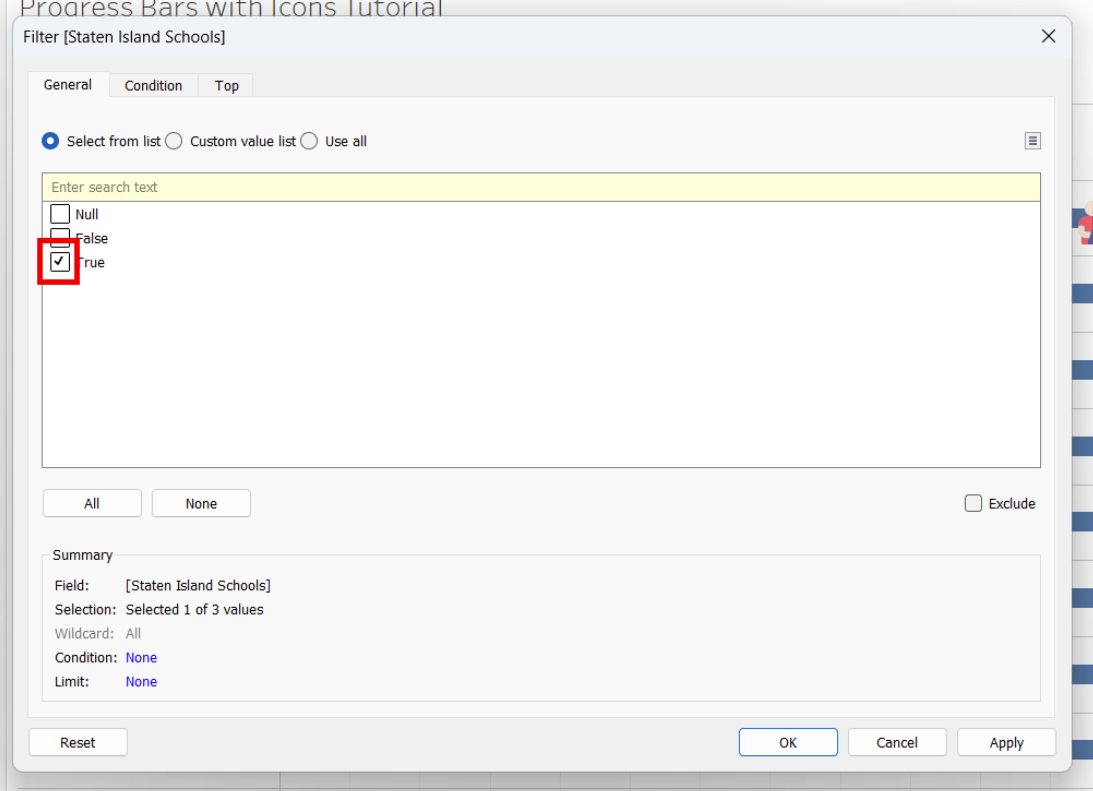
Press okay. Click and drag the new STATEN ISLAND SCHOOLS pill to the filter shelf. Tableau will ask you if you want to display all of the criteria that do or do not meet the request. We do want to see all of the Staten Island schools, so select TRUE!
All of the DBN’s that remain contain an “R” and therefore those are all of our Staten Island schools!
Want to take a look at other boroughs? “Duplicate” the STATEN ISLAND SCHOOLS pill and then update it, replacing “R” with an “X” for the Bronx, “K” for Brooklyn, “Q” for Queens, or “M” for Manhattan.
Let’s keep going.
- Sort the schools in ascending order by Total Student Response Rate.
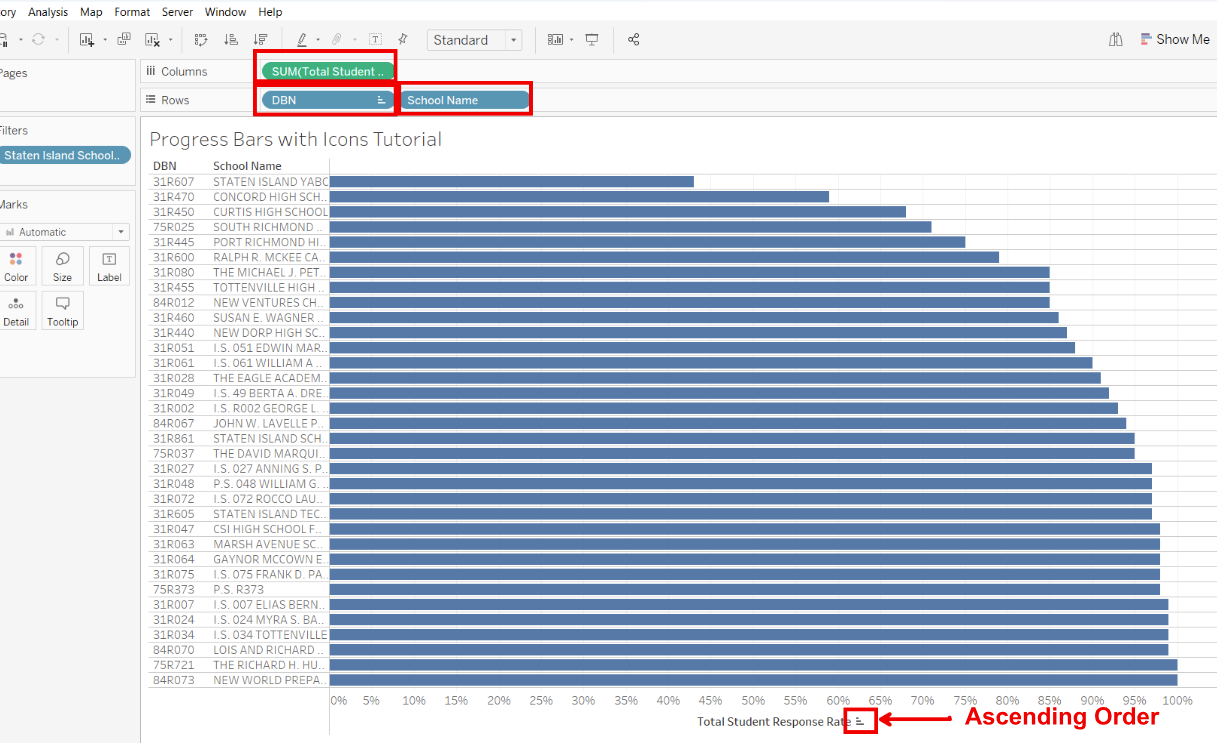
From the data pane, find and bring SCHOOL NAMES onto the rows shelf. Bring TOTAL STUDENT RESPONSE RATE (%) to the columns shelf. Sort in ascending order so that we see the schools with the lowest student response rates at the top.
- Limit the view to just the Top 10 Staten Island schools.
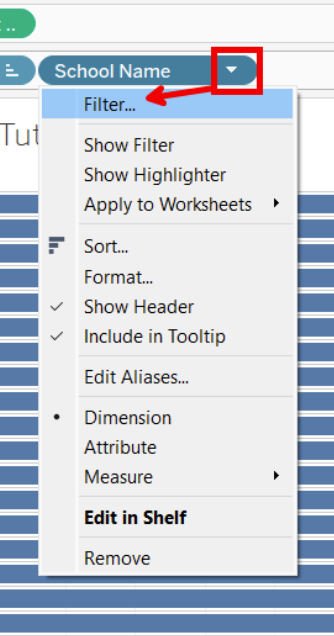
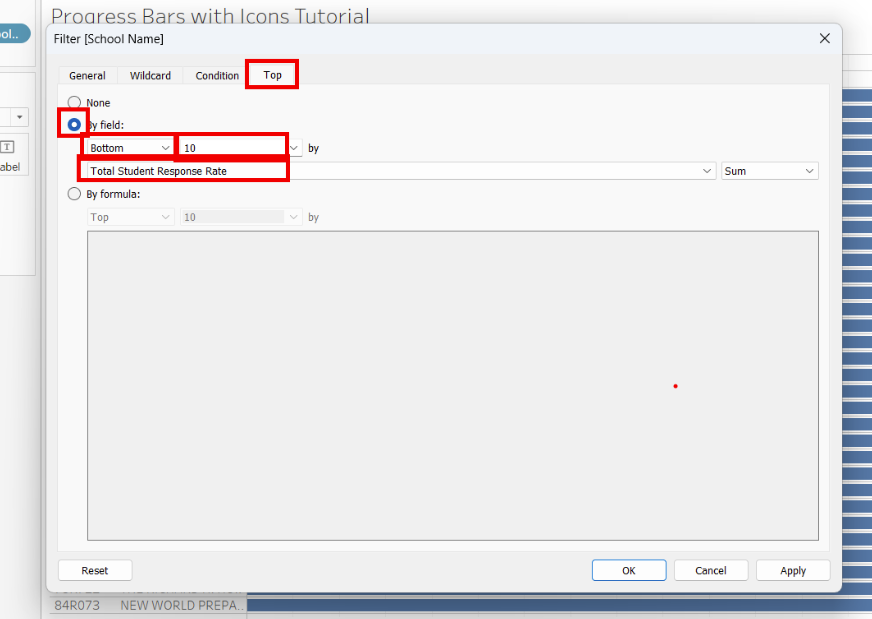
Right-click the SCHOOL NAMES pill and select “Filter”. Navigate to the “Top” tab and set the settings to the “Bottom” “10” by “Total Student Response Rate”.
*Results disappeared?
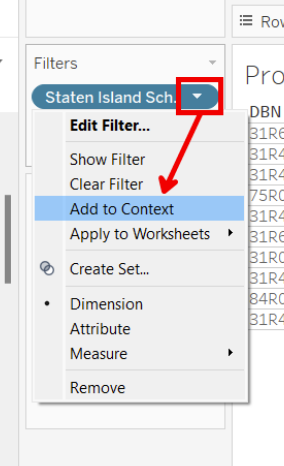
Since there are no Staten Island schools in the Bottom 10 schools throughout the entire data set, we need to switch our STATEN ISLAND SCHOOLS pill in the Filter Shelf from a Dimension Filter to a Context Filter. To see the Bottom 10 Staten Island schools, we need to navigate to our Filters Shelf, right-click on the STATEN ISLAND SCHOOLS pill and select “Add to Context”.
If you would like to learn more about this, check out the Context Filters section in my blog post on the Tableau Order of Operations.
- Create 2 charts! One for your progress bars and one for your icons!
Once you have 10 Staten Island schools in the view, right-click on your mouse or Ctrl+click (Mac: Cmd+click) on your keyboard to select the student responses pill and drag it to the right. This will create a duplicate of that pill and a duplicate of our current graph.

- Switch the mark type from bar to shape and select your progress bar indicator.
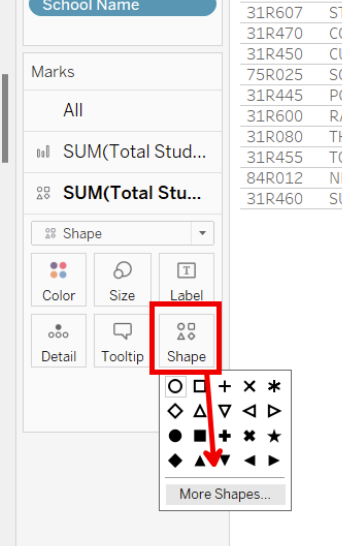
Navigate to the third marks card on the left, also titled “Total Student Response Rate”. Select “Shape” from the drop-down options.
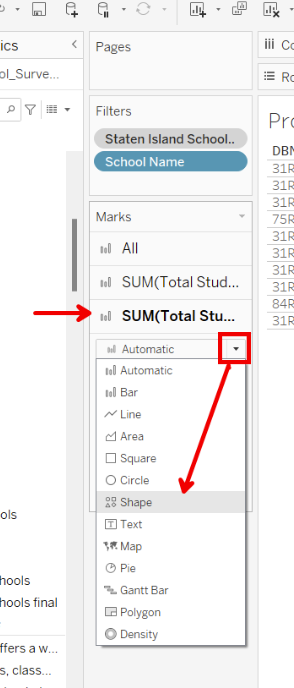
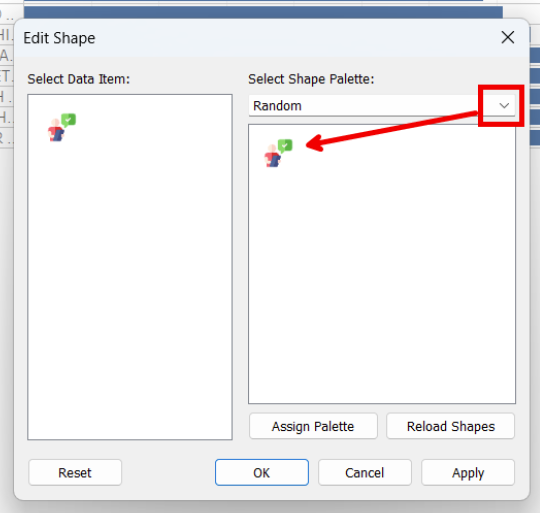
From the Mark options, select “Shapes”. Choose your progress bar indicator from this menu or if you would like to see more options, select “More Shapes…”. I will be using a Custom Shape.
*Want to learn to use your own Custom Shapes? Watch this video!
- Resize for visual appeal.
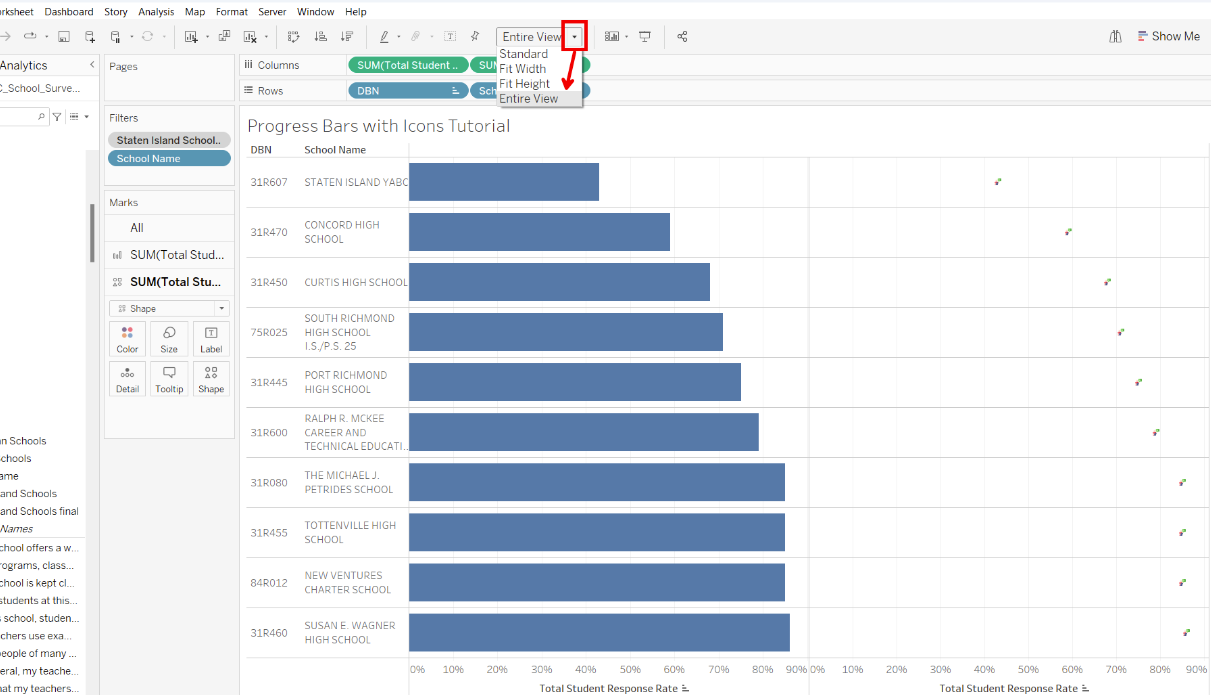
Let’s resize our view so that we can see everything. Increase the height of the graph by a) clicking and dragging, b) pressing ctrl and the up arrow, or c) selecting ‘Entire View’ or ‘Fit Height’ from the top menu bar. I have chosen to expand by selecting “Entire View”.
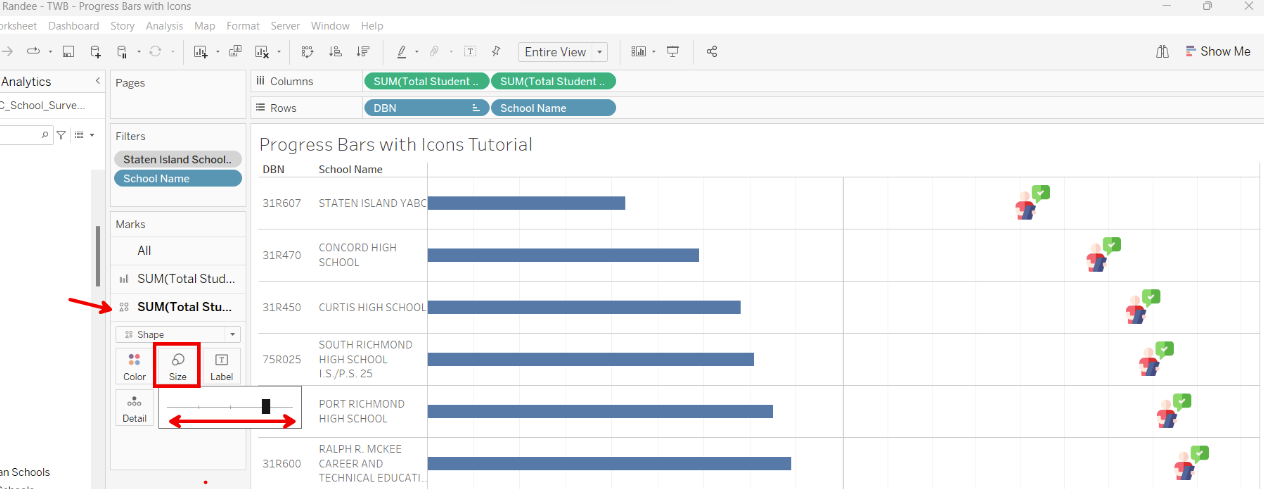
Make the bars narrower by navigating to the second marks card for the bar chart and changing their size.
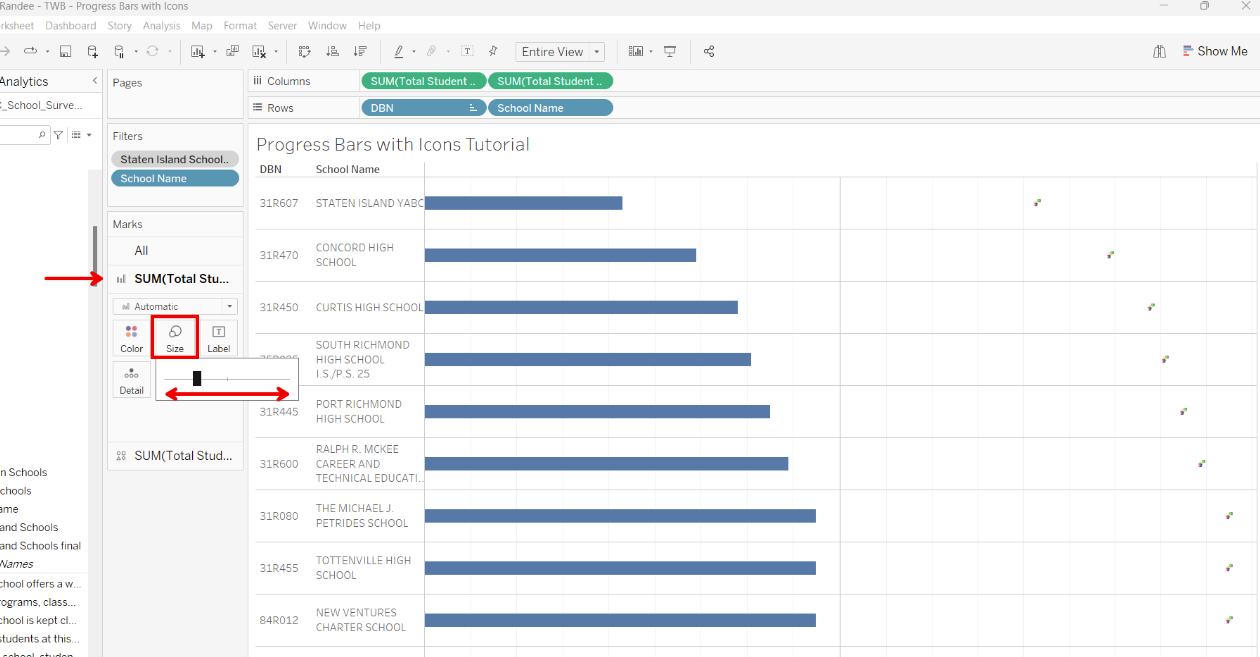
Make the icons larger by selecting the third marks card for the icon chart and changing their size.
- Combine the 2 charts to appear as 1!
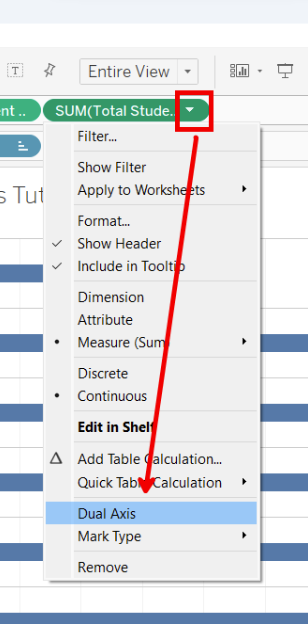
Right-click on the second pill in the column shelf and select “Dual Axis”.
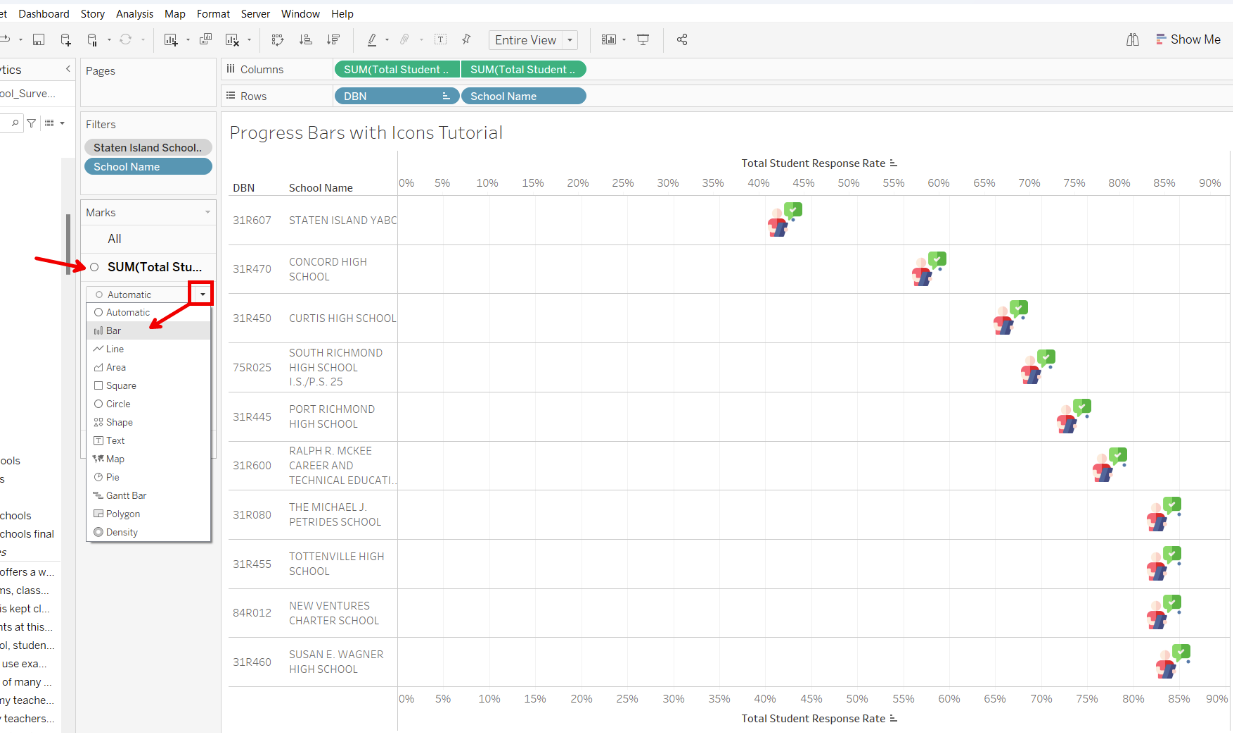
Notice that the bars have disappeared. Tableau thinks that we now want both fields to be displayed as shapes since we have put both axes within the same pane. To get back to what our goal is, navigate to the second marks card for the bar, and in the drop-down, change it from “Automatic” back to “Bar”.
Get everything to line up appropriately by right-clicking on either the top or bottom axis and selecting ‘Synchronize Axis’.
Before:
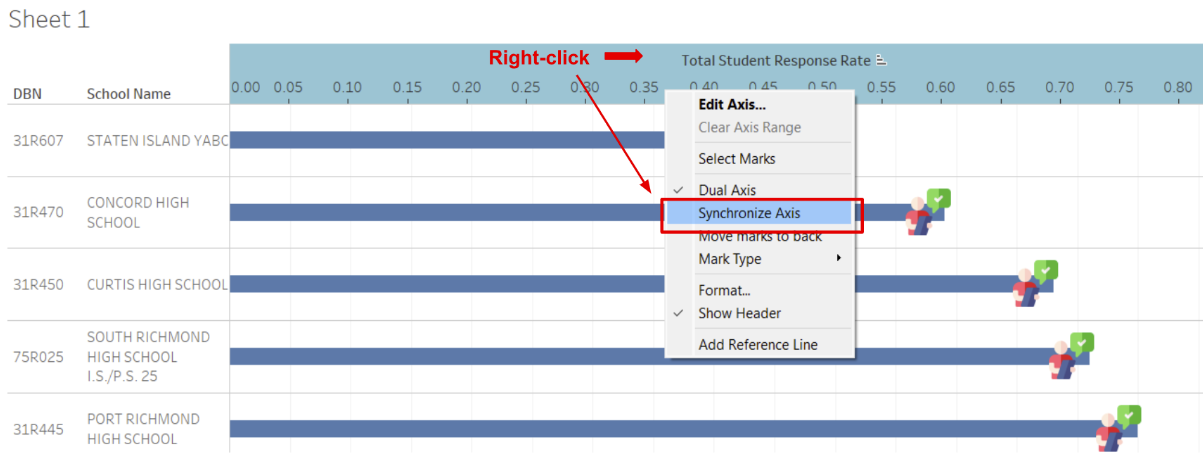
After: Notice that the icons are now lined up at the end of the bars, rather than almost at the end of the bars.

- Style accordingly.
Add the percentage labels to the icons: Convert the decimal representation into a percentage. To do this, navigate to the ‘TOTAL STUDENT RESPONSE RATE’ pill in the Data Pane. Right-click it to select ‘Default Properties’ and then ‘Number Format…’.

Choose ‘Percentage’ and set the number of decimal places that you want to be displayed. I will set mine to 0.


Place them on the icons by navigating to the icons marks card. Select ‘Labels’ and in the pop-up, select ‘Show mark labels’. Feel free to customize the rest of the settings accordingly. I want my percentage labels to the right of my icon and I will also choose my font sizing and color.

Clean up the chart: Get rid of the gridlines, remove axes, hide the field labels for the rows, turn off tooltips, format the school names, hide the DBN codes, and always give your chart a title!
Final Result:

Connect with me on LinkedIn!