


When preparing data for analysis, you may encounter tables where some (key) columns contain many null values. At first glance, it looks like important information is missing. But often, these “nulls” are not missing data. They are just left empty for readability, because the values are the same as above.
Example Table
| Group | Code | Item | Cycle | Value A | Value B |
|---|---|---|---|---|---|
| Gamma | X03 | Element 6 | 2022 | 1200000 | 1400000 |
| Element 7 | 2100000 | 2500000 | |||
| Alpha | X01 | Element 1 | 2021 | 1250000 | 1500000 |
| Element 2 | 980000 | 1200000 | |||
| Element 3 | 720000 | 950000 | |||
| Delta | X04 | Element 9 | 1340000 | 1520000 | |
| Element 10 | 875000 | 1030000 | |||
| Beta | X02 | Element 4 | 615000 | 800000 | |
| Element 5 | 1800000 | 2050000 | |||
| Element 8 | 995000 | 1150000 |
❓ Question 1: Why does this happen?
- In Excel reports and human-readable tables, repeated values are often left blank to avoid redundancy, or simply because it is more convenient not to enter the same information again and again.
- For example: In above table “Gamma / X03 / 2022” is written once at the top, and then omitted for the following rows.
- When imported into Power BI, Alteryx, Tableau Prep, or Excel Power Query, these blanks are treated as null values.
👉 So the data isn’t missing — it’s just implicitly the same as the value above.
❓ Question 2: How do we solve it?
The solution is always the same: Fill Down.
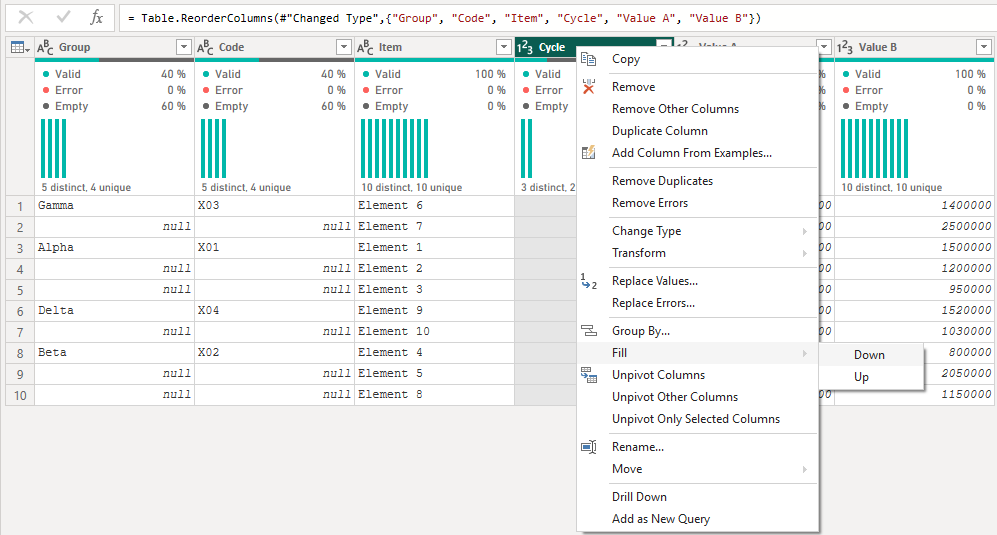
🟢 Power BI (Power Query)
- Select the column you want to fix → Right-click column header → Fill → Down.
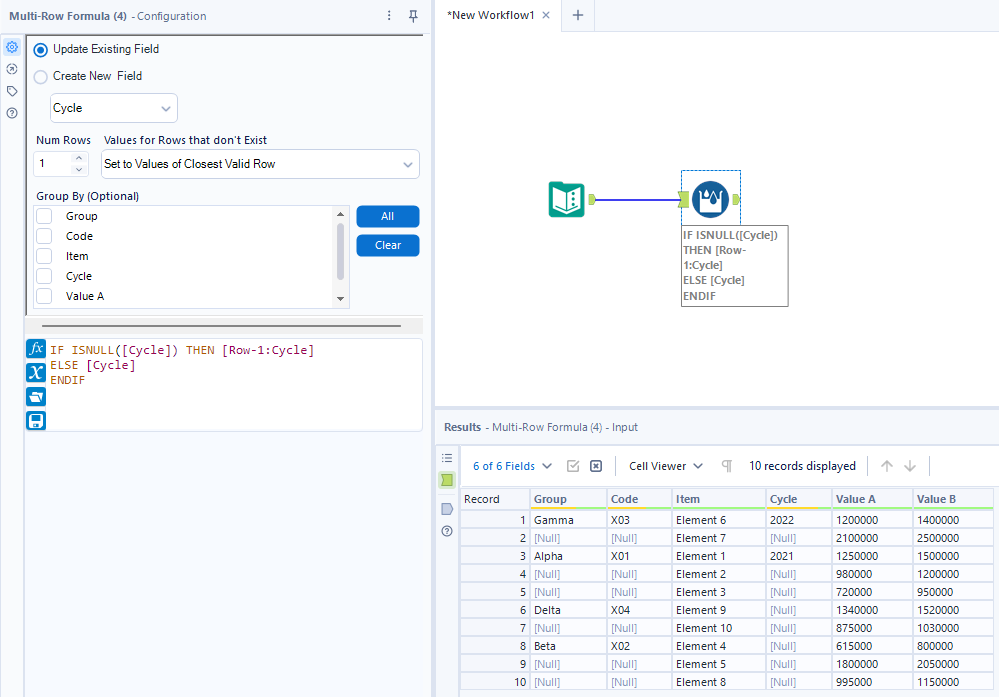
🟢 Alteryx
Use a Multi-Row Formula Tool with the following code:
IF ISNULL([Cycle]) THEN [Row-1:Cycle] ELSE [Cycle] ENDIF
👉 This code (Alteryx Expression Language) checks if the current row’s Cycle value is null, and if so, it replaces it with the Cycle value from the row above, otherwise, it keeps the existing value.
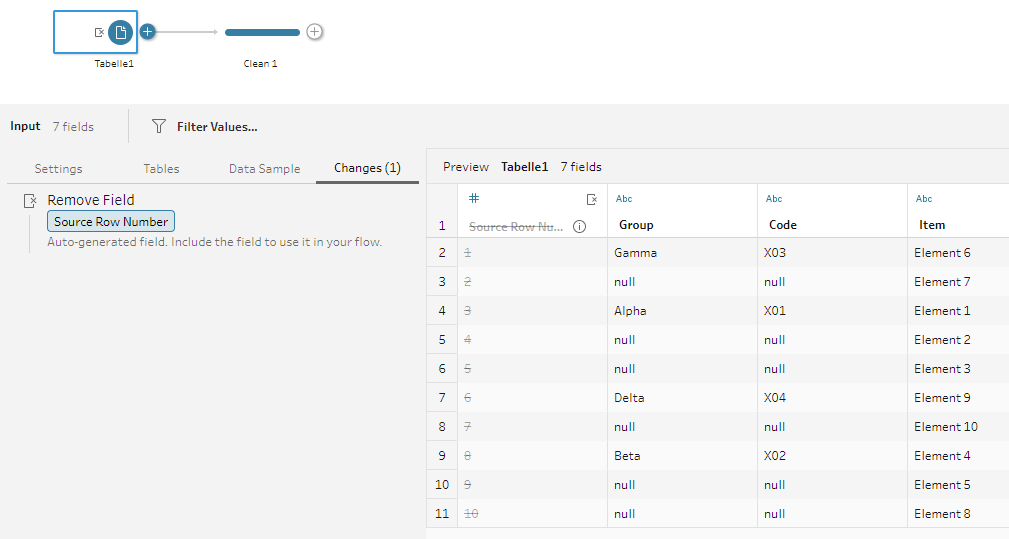
🟢 Tableau Prep
- In the Input step, make sure to include the field Source Row Number (introduced in Tableau Prep 2023.1). By default this field is hidden, so you need to manually add it back from the Changes pane (By deleting the change).
- Add a Clean Step to your flow.
- In the Clean Step, select the column where blanks appear and choose Fill → Down.
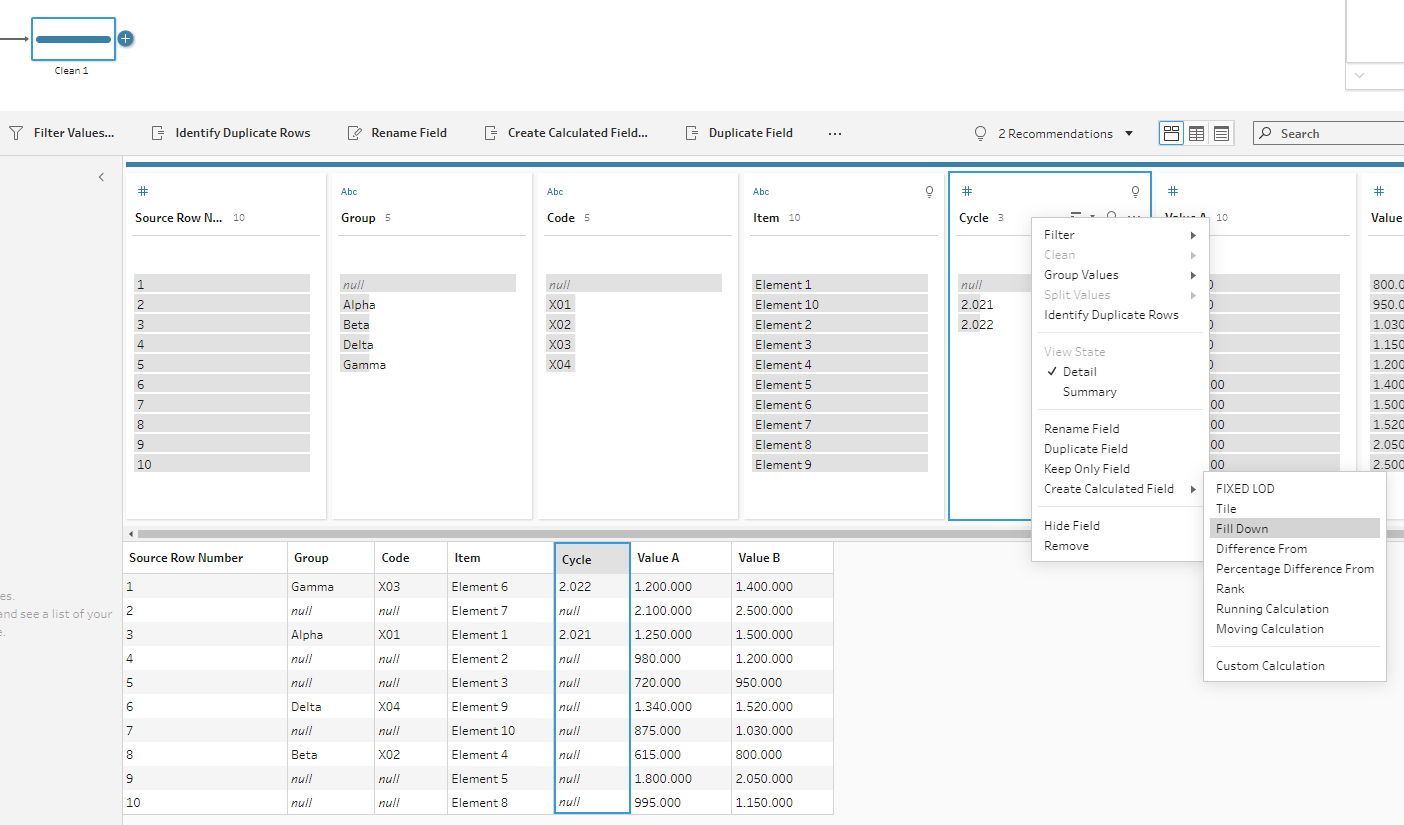
- In the Fill Down options, set Order by = Source Row Number.
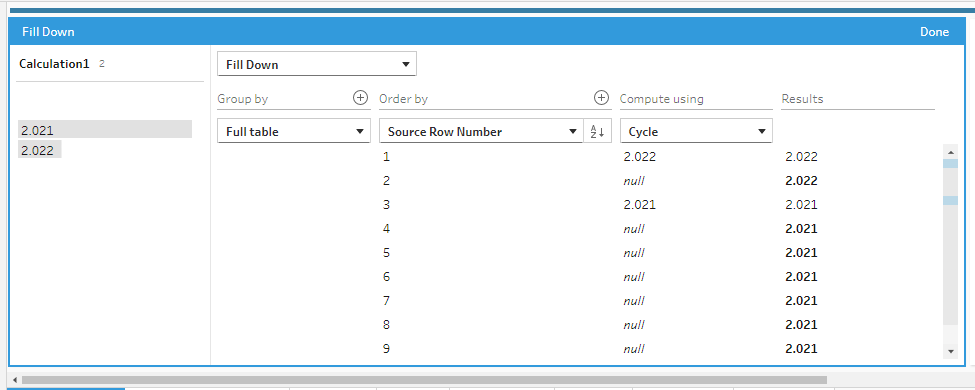
👉 You could also use another index column if one is already available in the table. If no such index exists, the automatically generated Source Row Number works just fine. It’s important not to use any other field unless you are certain it is a proper index, because using the wrong field for ordering can change the row sequence in an unintended way.
🟢 Excel
There are two main ways to fix these blanks in Excel:
1. Power Query (recommended)
- Select your table or data range in Excel.
- On the ribbon, go to Data → Get & Transform → From Table/Range. This opens the Power Query Editor.
- In Power Query, right-click the column with blanks → Fill → Down.
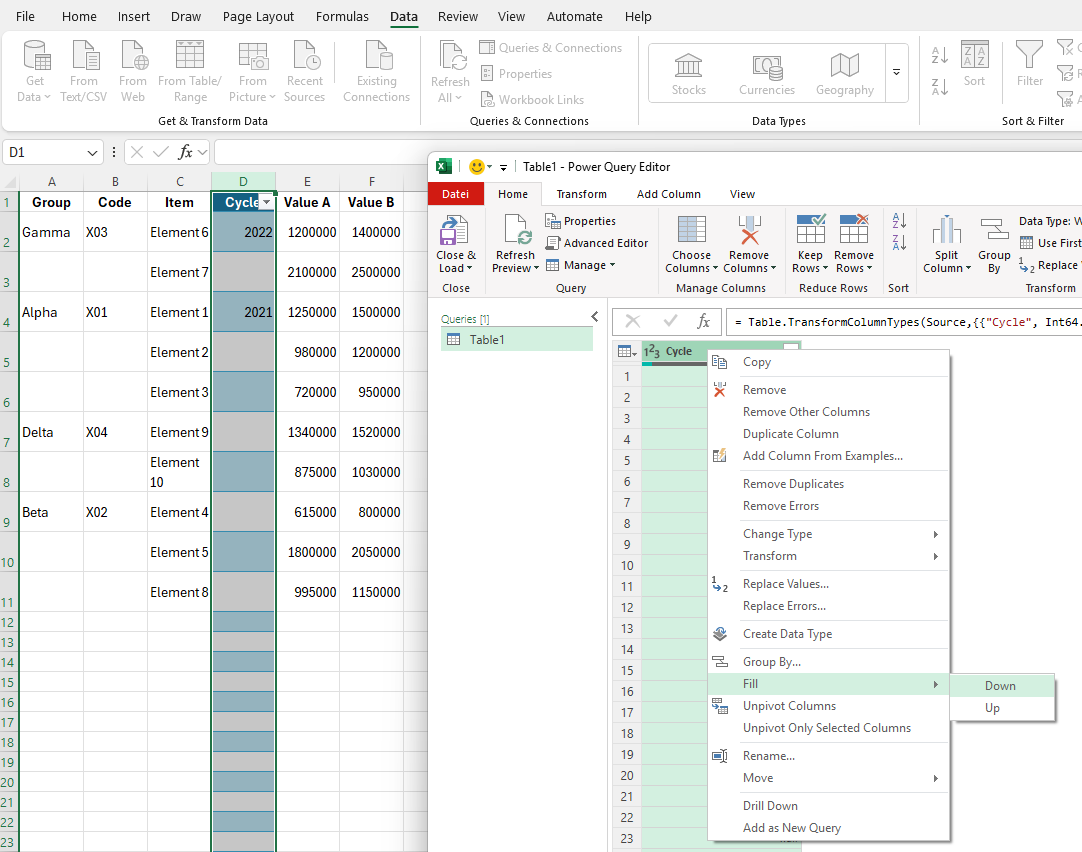
- Close & Load the query back into Excel.
👉 This uses the same engine as Power BI as both software products are from same company, so the steps are almost identical. The fix is applied automatically every time you refresh your data.
2. Manual Fill Down (quick one-off)
- Go to the first non-null cell in the column.
- Double-click the small square handle (the fill handle) at the bottom-right corner of the cell.
- Excel will automatically fill the value down into all empty cells below, until it reaches the next non-null cell (behaving like a Fill Down function).
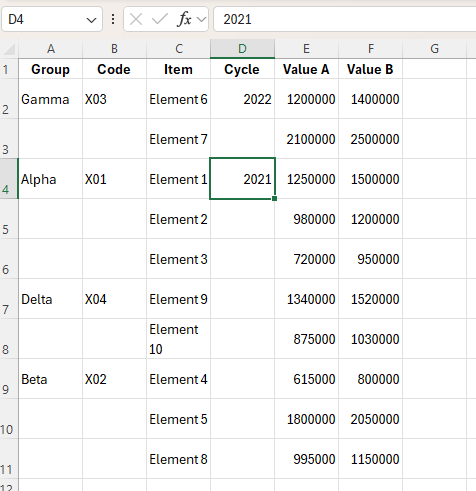
👉 It is fast, but it is manually and not dynamic if the data changes.
🔑 Key Takeaway
These nulls are not always errors or missing data — they are sometimes just shortcuts in table formatting.
For proper analysis, always fill them down so that every row is complete.