


This week’s #MakeoverMonday task revolved around a map of Scotland and a lot of people wanted to implement something similar in their own vizzes. Some issues occurred when trying to isolate Scotland from the surrounding area, so I thought it might be helpful to compile the resources that helped me to create the map in Mapbox and also include any additional steps (such as region grouping) I took to create my final visualisation.
Let’s get started!
Step 1 – Getting the shape file
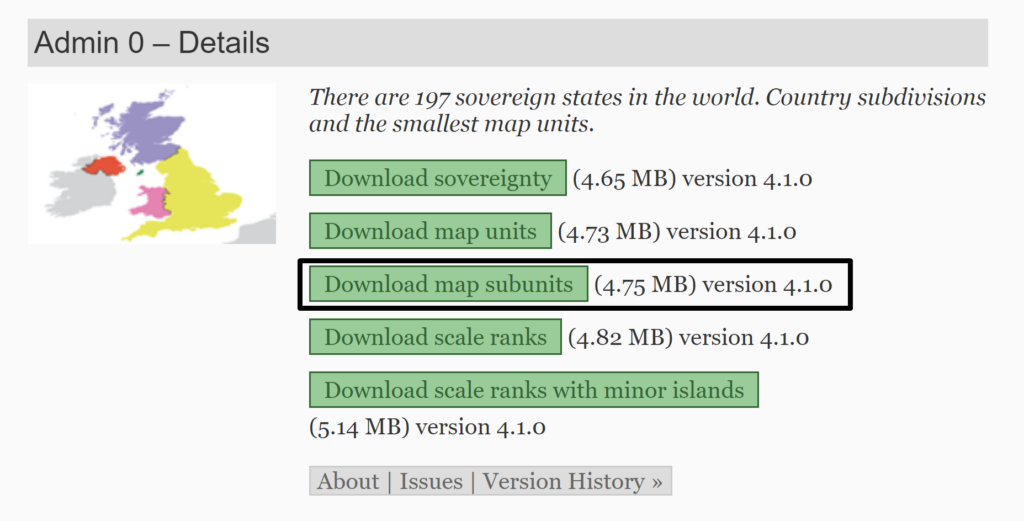
To be able to only show Scotland on the map, we must first have a shape file so we can pick out Scotland and filter out everything else. The shape file can be found here. From there, you can scroll down and click “Download map subunits” under the “Admin 0 – Details” section to download it.
Step 2 – Uploading it to Mapbox
This video is very helpful to show you how to bring the actual shape file into Mapbox. It also explains how to filter out the surrounding area and have a transparent background with a coloured map. If you are just looking to have a single coloured map with no background, then you can stop here! Phew!
However, if you would like to find out how to have a “textured” map and change the colour of your background, then I highly recommend watching this video by Jonni Walker. He explains everything in a lot of detail and teaches you how to do amazing effects using Mapbox – check it out!
I will now tell you more about how I did the map for my viz!
Step 3 – Filtering Scotland and Styling the Map
The methods I used for the following step are inspired by Jonni Walker’s video that I mentioned previously.
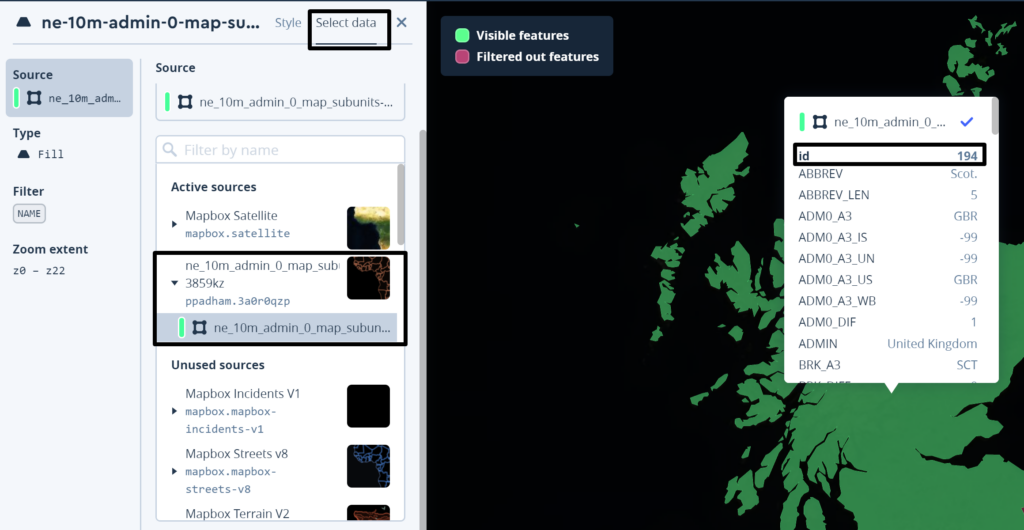
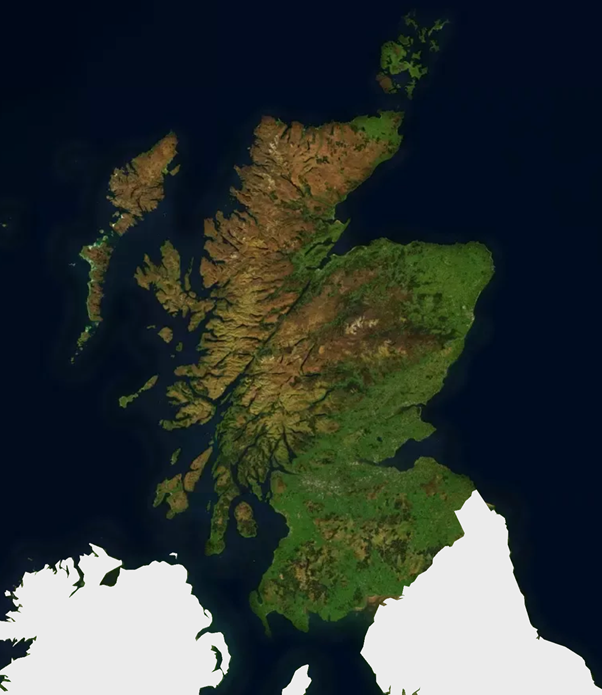
To filter Scotland, we can click on it on the map when we are on the “Select Data” view. A pop-up panel with an id number will then appear, as shown below:
If we click on “Style” next to “Select data”, we will see an option to “Style with data conditions”.
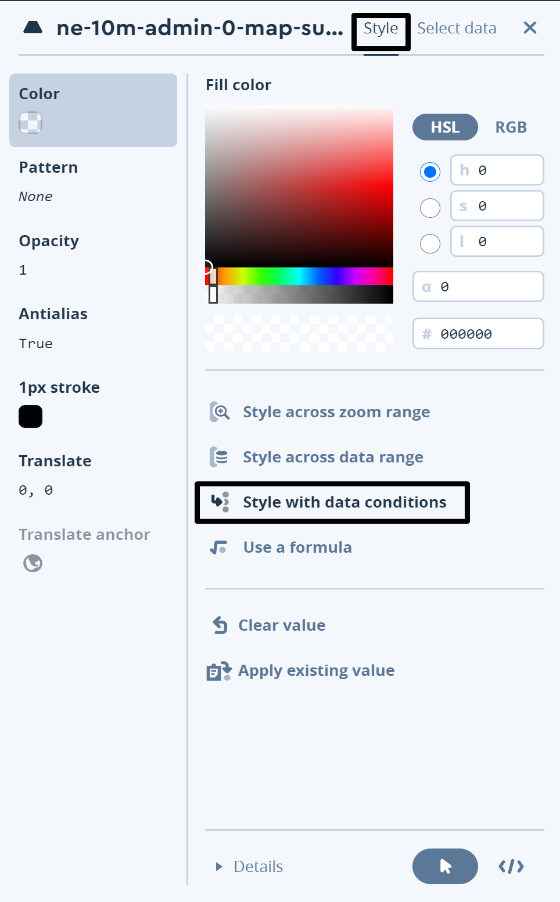
Choose the id field and then enter in “194” as that was the id number for Scotland, and then click “Use”.
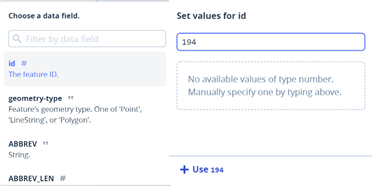
Now you can set the id colour to be transparent using the bar shown below so that Scotland is visible and click “Done”.

After that, set the “Fallback value” to whatever colour you would like your background to be.
But wait!
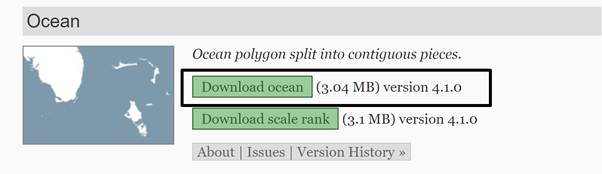
The areas of land we don’t want have changed colour, but the surrounding water is still the same! To fix this, visit this page to download the ocean shape file.
From there, upload it as you did with the previous shape file and then add it as a new layer. Once you’ve done that, go back to the “Style” view, change to your desired colour and we’re done!
To get this satellite map style, simply create a new layer and go to the “Select data” view and find “Mapbox Satellite” under the “Unused sources” section. After that, drag and drop this new layer underneath both the ocean and map subunit layers on the far left panel.
Step 4 – Fixing the regions in Tableau
When you use the dataset as it is, you may have run into the problem that Tableau can only display one part of Ayrshire and Lanarkshire, which results in a map with missing areas.
To solve this issue and display the full areas on the map, I edited the dataset to include all of the missing areas, as shown below:

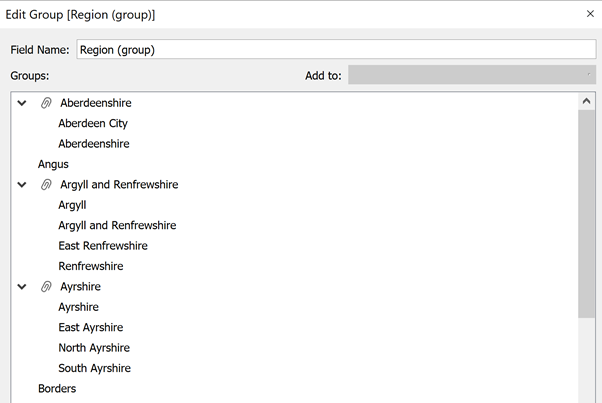
After doing this, you can right-click on the “Region” Dimension and select “Create” and then “Group…”. You can then group together each region, for example placing North and South Ayrshire under “Ayrshire”. Here is an example of what mine looked like:
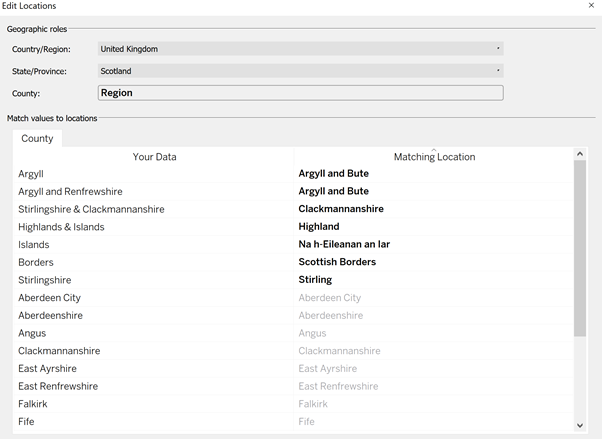
After clicking “OK”, drag the new group you created onto the Detail mark. You can then click “Map” on the top toolbar and “Edit Locations” to ensure that all the counties have the correct matching locations. Here is an example of how mine looked:
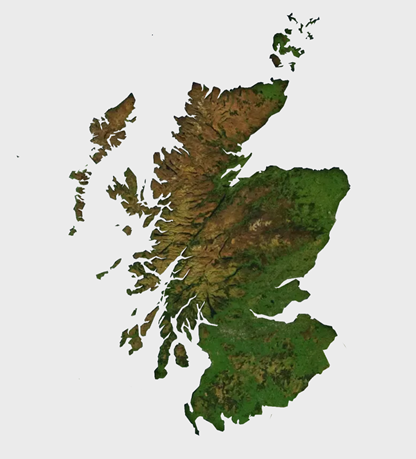
You should now be able to see a lovely filled map with all the regions! You can also download the colour palette I used called Viridis here.
Although these solutions aren’t perfect, this is what worked for me with my current experience level. I can’t wait to learn better ways of solving these issues in the future!
I hope this post was useful and please do get in touch with me on twitter (@p_padham) if you need any help!
You can view and download my workbook here.