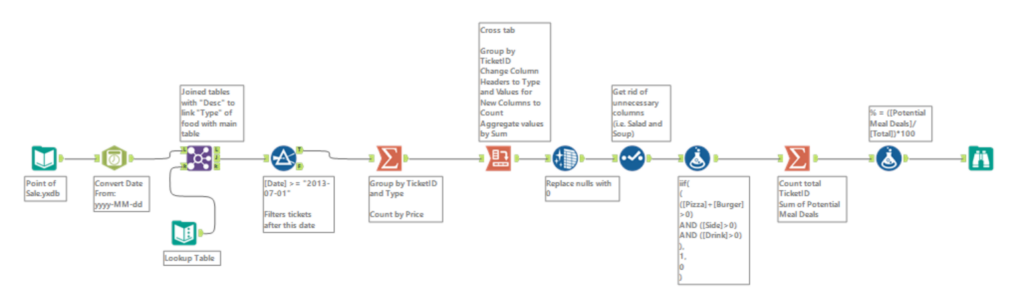
This challenge revolves around a new “Meal Deal” being added to a menu and we had to study the potential impact on recent transactions. The task was to identify the total and percentage of tickets since July 2013 in the following food categories: Pizza OR Burger, along with a Side and Drink.
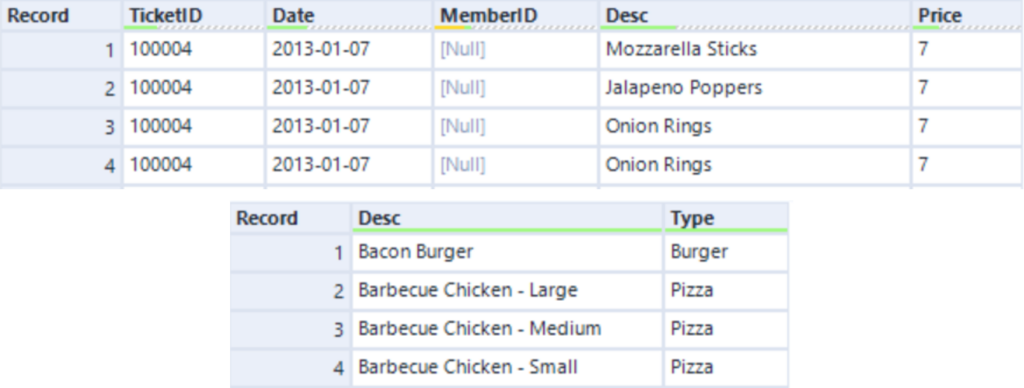
There were two inputs – the Point of Sale and Lookup Table. The Lookup Table would be used to match up the food descriptions with the food type.
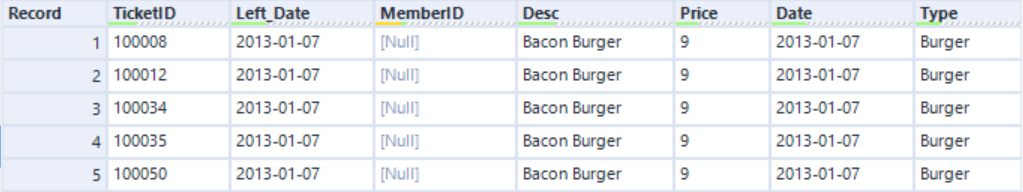
Here are snippets of how the inputs looked:
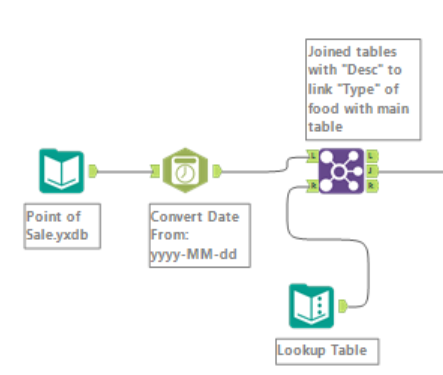
As the Date field within the Point of Sale dataset was currently a string, I used the DateTime tool first to convert it to the appropriate date format before joining both tables together.
Then I used the Join tool to join both tables together by their Desc fields.
Here is a snippet of how the resulting table looked after this join:
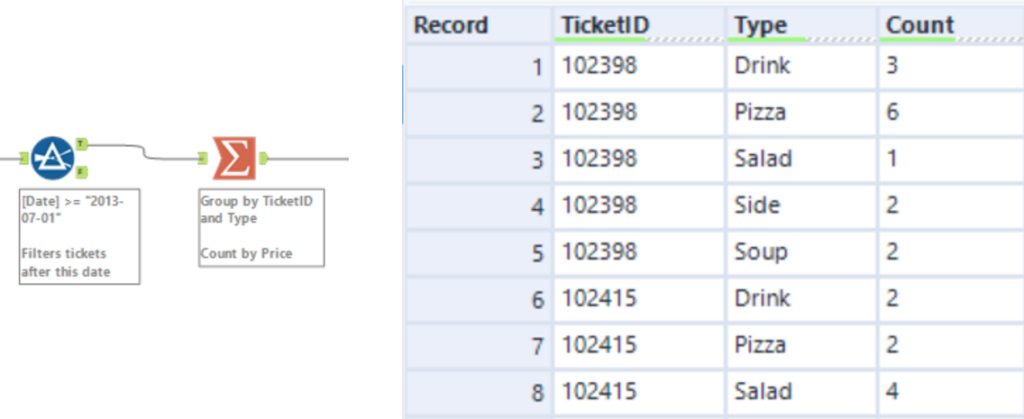
Now we need to filter all tickets after July 2013 and group by TicketID and Type. I used a Filter tool with the basic filter of [Date] >= “2013-07-01”. Then I used a Summarize tool in order to group together the TicketID, as well as group by the Type. I also used it to get a count using the Price field.
Here is the result:
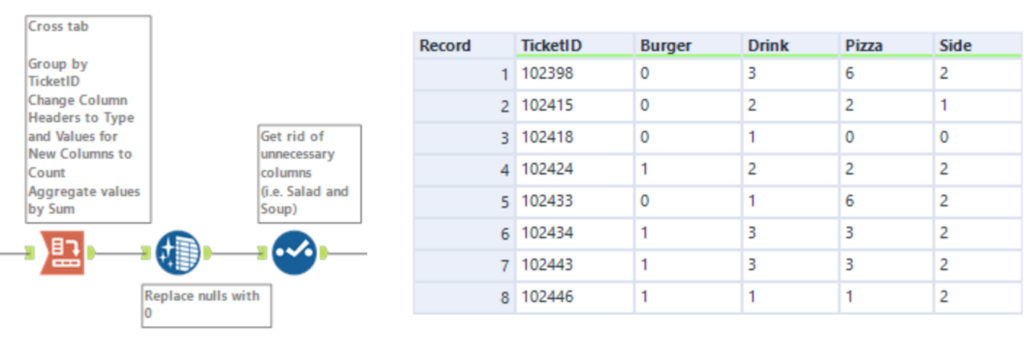
After that, I used a Cross Tab tool to group by TicketID and to change the Column Headers to Type. The Values for New Columns would be Count and the Method for Aggregating Values will be Sum.
As not every order contained every food type, there were some null values that needed cleaning. I used a Data Cleansing tool to replace nulls with 0. Then I used a Select tool to get rid of unnecessary fields, (i.e. the “Salad” and “Soup” fields).
Here is the result after doing these steps:
Now that we have a table with the tickets and the food items that correspond to each ticket, we can now see which tickets fulfil the criteria for the new meal deal. To do this, I used a Formula tool with the following statement:
iif(
	(
		([Pizza]+[Burger]>0)
		AND ([Side]>0)
		AND ([Drink]>0)
	),
	1,
	0
)
This statement first checks if “Pizza” AND “Burger” is greater than 0, as we only need one of these food items in order to fulfil the meal deal. As we need both a Side AND a Drink in order for the meal deal to be fulfilled, both of these must be greater than 0. Therefore, if a TicketID fulfils a meal deal, then “1” will be inserted in our new column alongside each row. However, if it is not fulfilled, then “0” will be inserted.
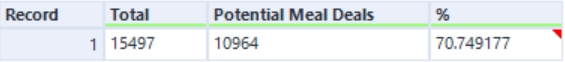
Now the final step is to count the total number of TicketIDs and calculate the sum of the Potential Meal Deals. This can be done using a Summarize tool. After that, we can simply add a Formula tool to do this calculation to work out the percentage of tickets that fulfil the meal deal criteria.
([Potential Meal Deals]/[Total])*100Here is our final output: