Today, we were given a website related to our interests and were tasked with webscraping/ using an API to extract the data and then build a dashboard.
My dataset was related to Pilates as I am a qualified instructor. The website contained 96 exercises with images and descriptions for each and the idea was to create an exploratory dashboard that allowed a user to see which exercises they could do for a particular muscle group.
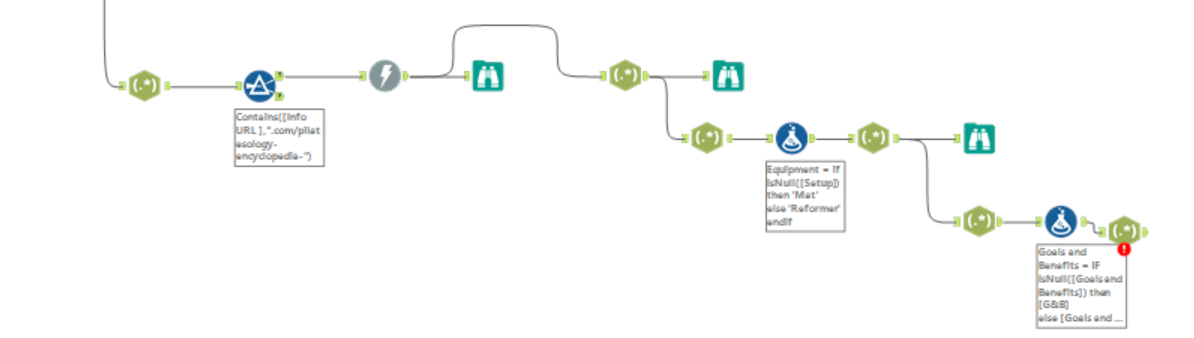
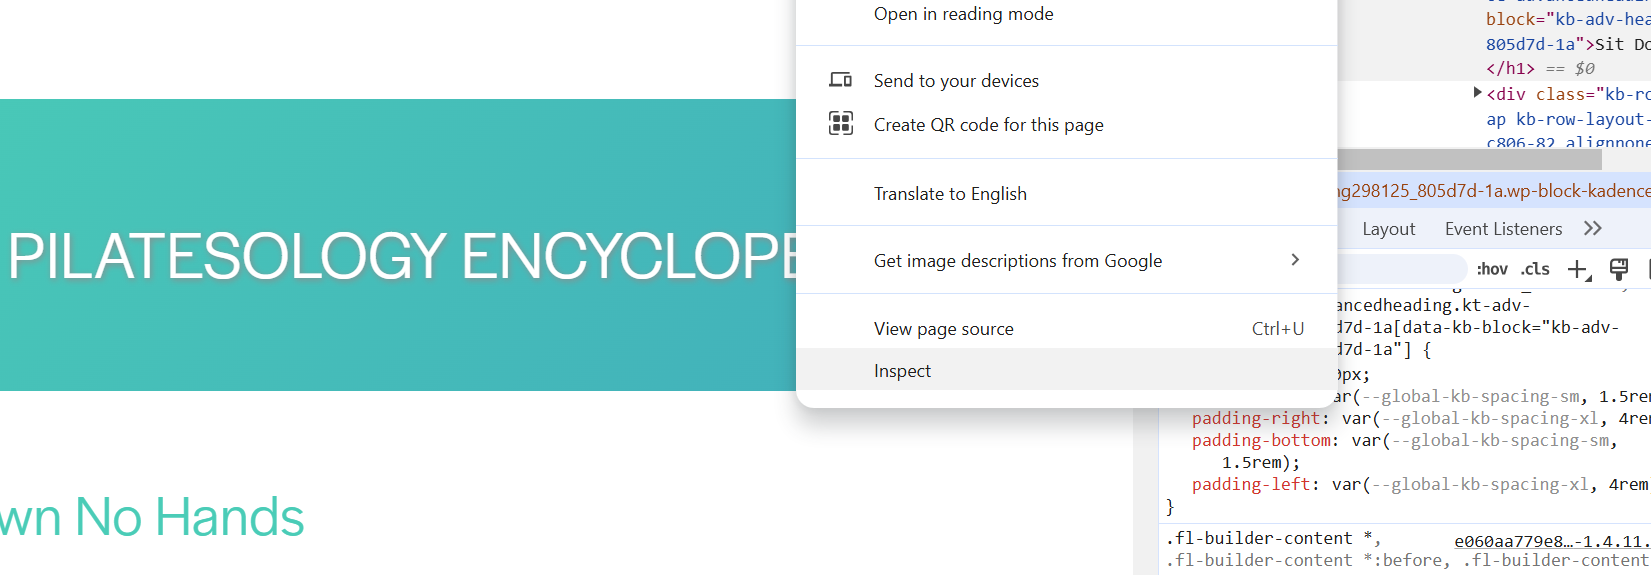
I started the day using the URL and download data tool to html. I then inspected the data on the website to see how I could split up the large parts of data and then extract what I needed to.
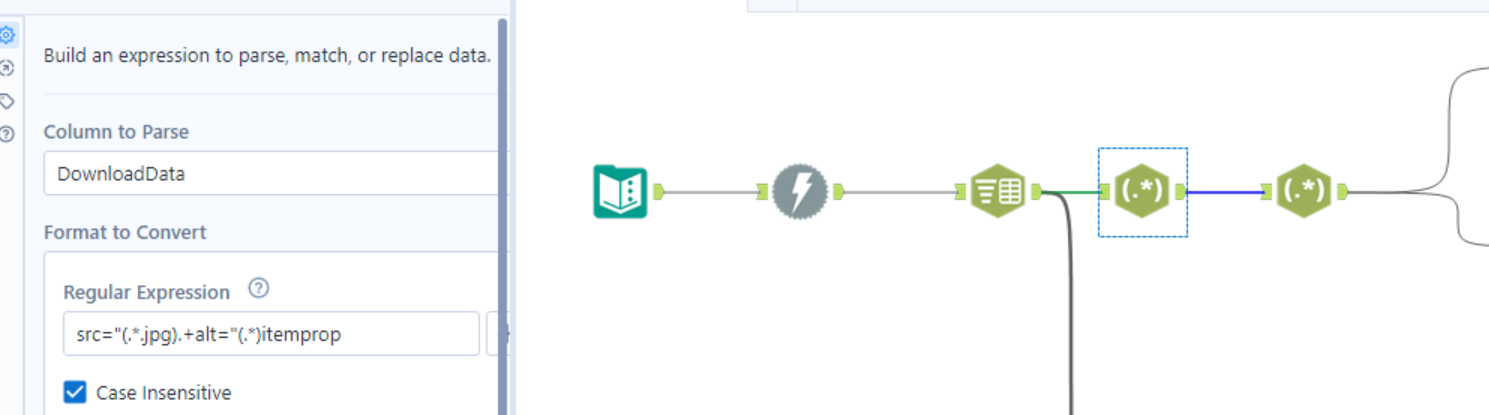
After downloading the data and identifying how I could split the html. I used the texts to rows tool to split the text per line and then regex to parse the images and exercises out. A great website I like to use for regex is Regex101 or ChatGPT.
I then worked on extracting more details out of the page. When clicking on an image, you were able to extract tips and cues for the exercise therefore I worked to extract these and provide some more information for the dashboard. I repeated the process of downloading the links embedded in the original pages and parsing out the information I needed.