As training comes to a close, DS47 have reached dashboard week where we will receive topics/ brief and have to create dashboards. To ease us in, we were given the Data+ TV challenge, where we have to take IMDB data and create a dashboard.
We received a starter dashboard that contained all the IMDB data on. My first idea was to narrow down this dataset into only the show I wanted. I filtered the dataset to the top rated series and realised The Office was on the list. Having loved the show for many years, I decided to take on the challenge.
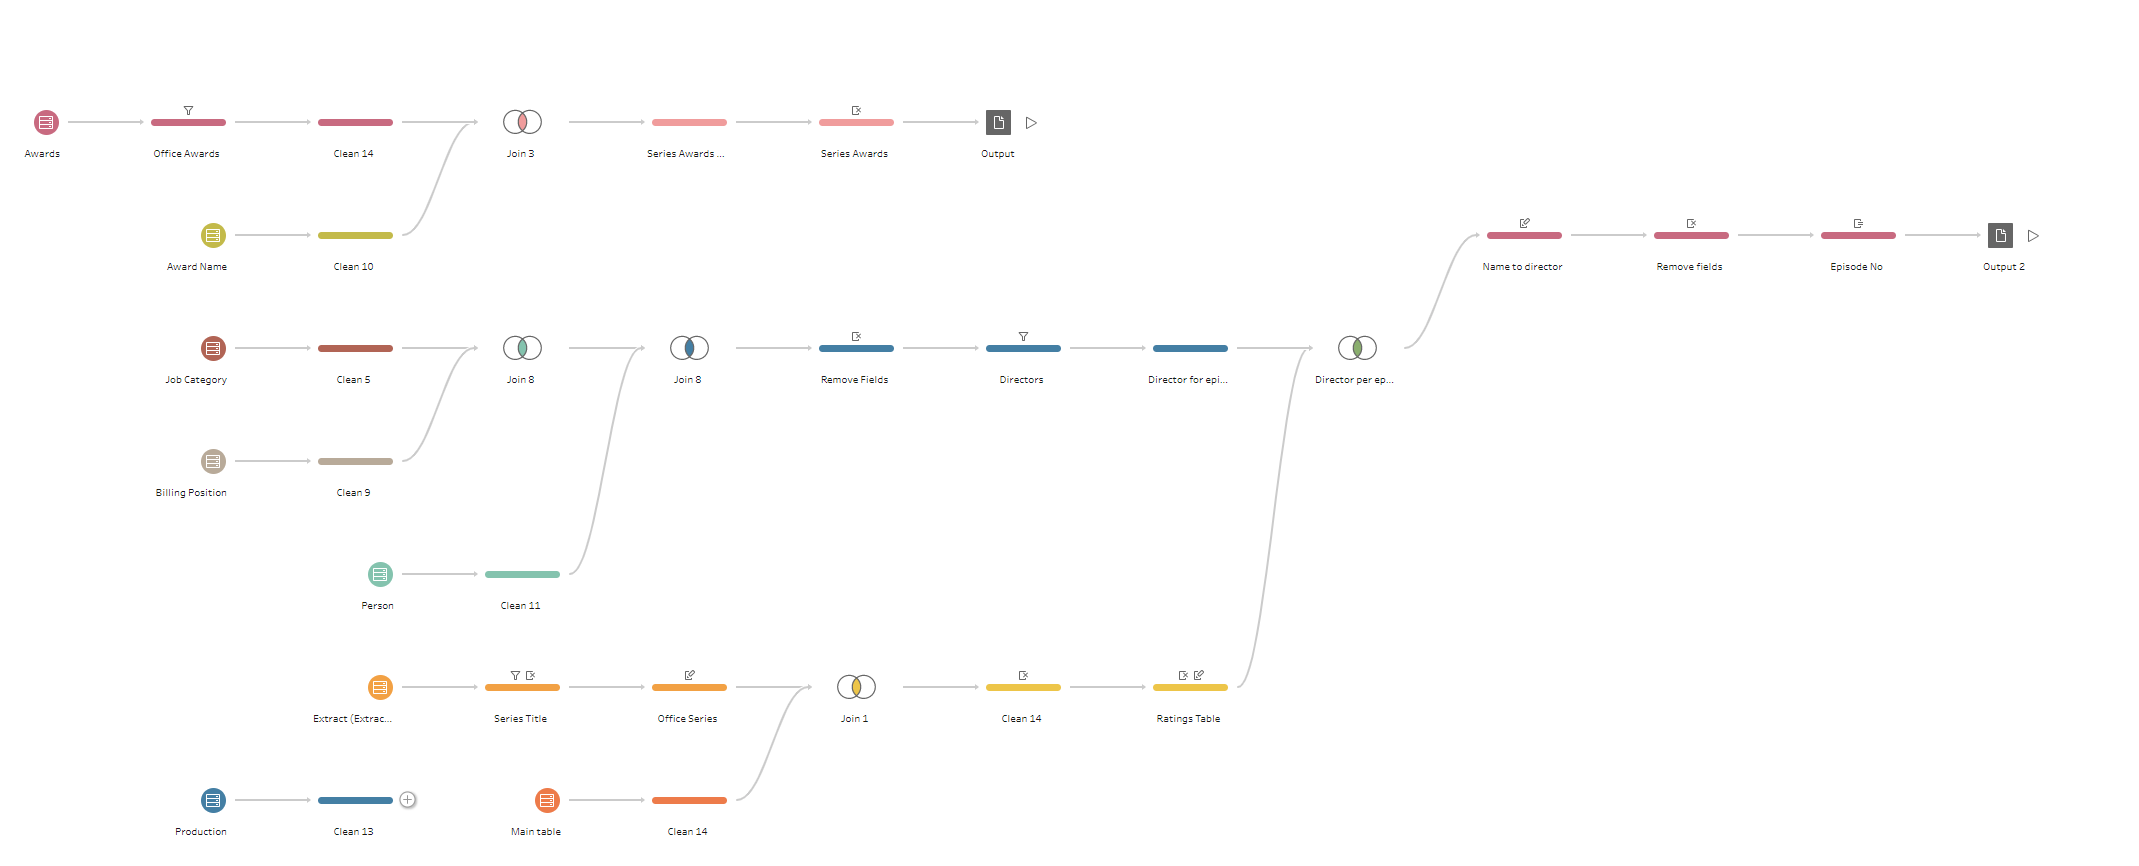
My first step was to create my own prep flow as the original dashboard was too slow. This proved to be a challenge as there were 12 original tables that contained information I needed. I had to find the common fields in some of them and create joins where necessary. I ended up with 2 main tables, one containing awards the show had won and one with ratings and directors. The prep flow ended up looking like this.
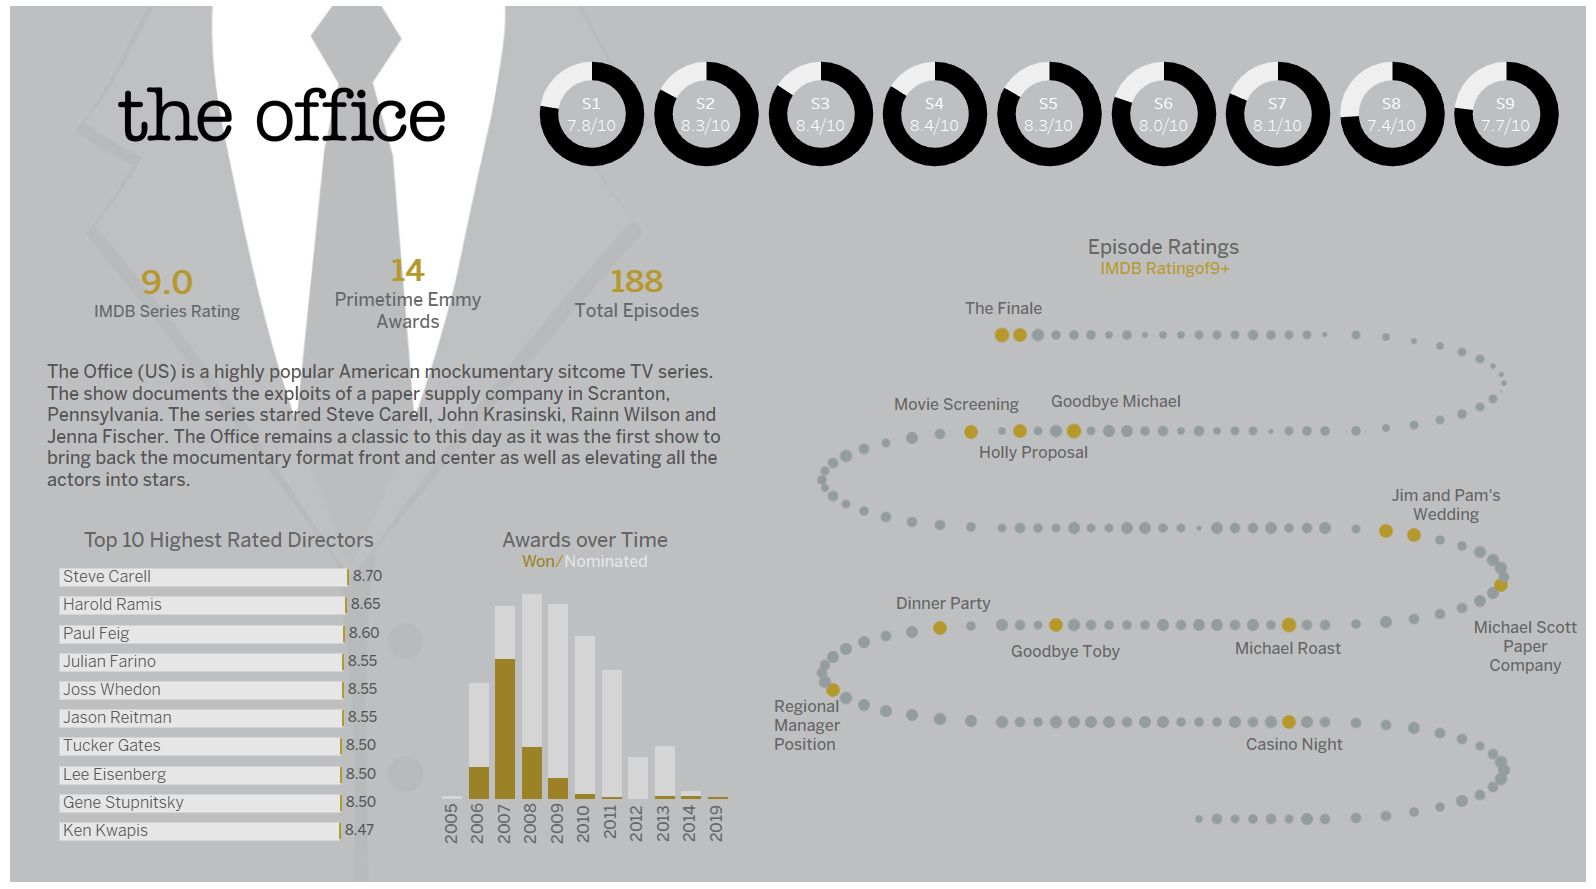
After taking the morning to confirm my data, I then put this into tableau and built my charts. I looked for inspiration on tableau public and decided to create a timeline of all the episodes in the office so that a user could clearly see the best rated episodes. I downloaded a workbook that contained this timeline and reverse engineered the dashboard to create my own chart. This was fun to build something different to the usual charts and channel my creativity.
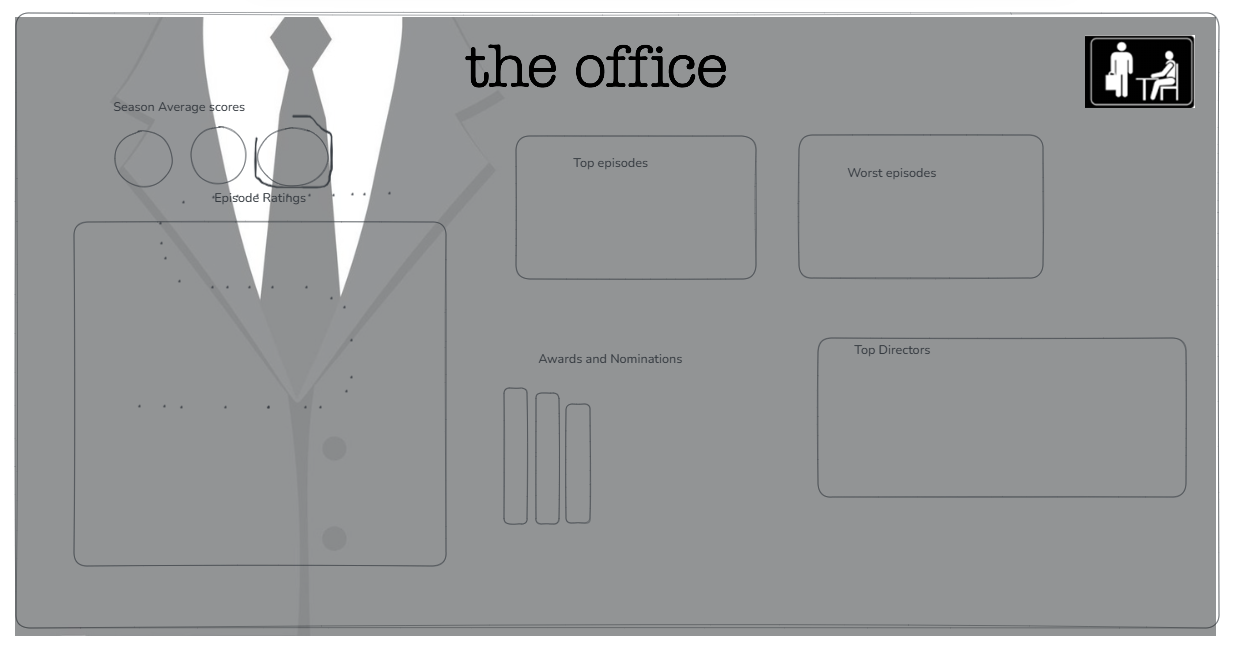
Here was my original sketch. This did differ from the final version as I realised the layout needed changing however, I largely stuck to the same graphs.
This was the finished dashboard! I thoroughly enjoyed this project and I enjoyed challenging my creativity. Creating an infographic was definitely difficult as I feel I rely on filtering and highlighting tools often therefore creating this style helped with being clear and succinct.