


Filter Action provides user higher level of visualization interactivity. When you want to use your chart as a filter for other graphs/charts, filter action is a good option to choose.
Filter actions send information between worksheets. Typically, a filter action sends information from a selected mark to another sheet showing related information. Behind the scenes, filter actions send data values from the relevant source fields as filters to the target sheet.
Let’s create a simple filter action in our very own Tableau. To create a filter action we need to follow these steps-
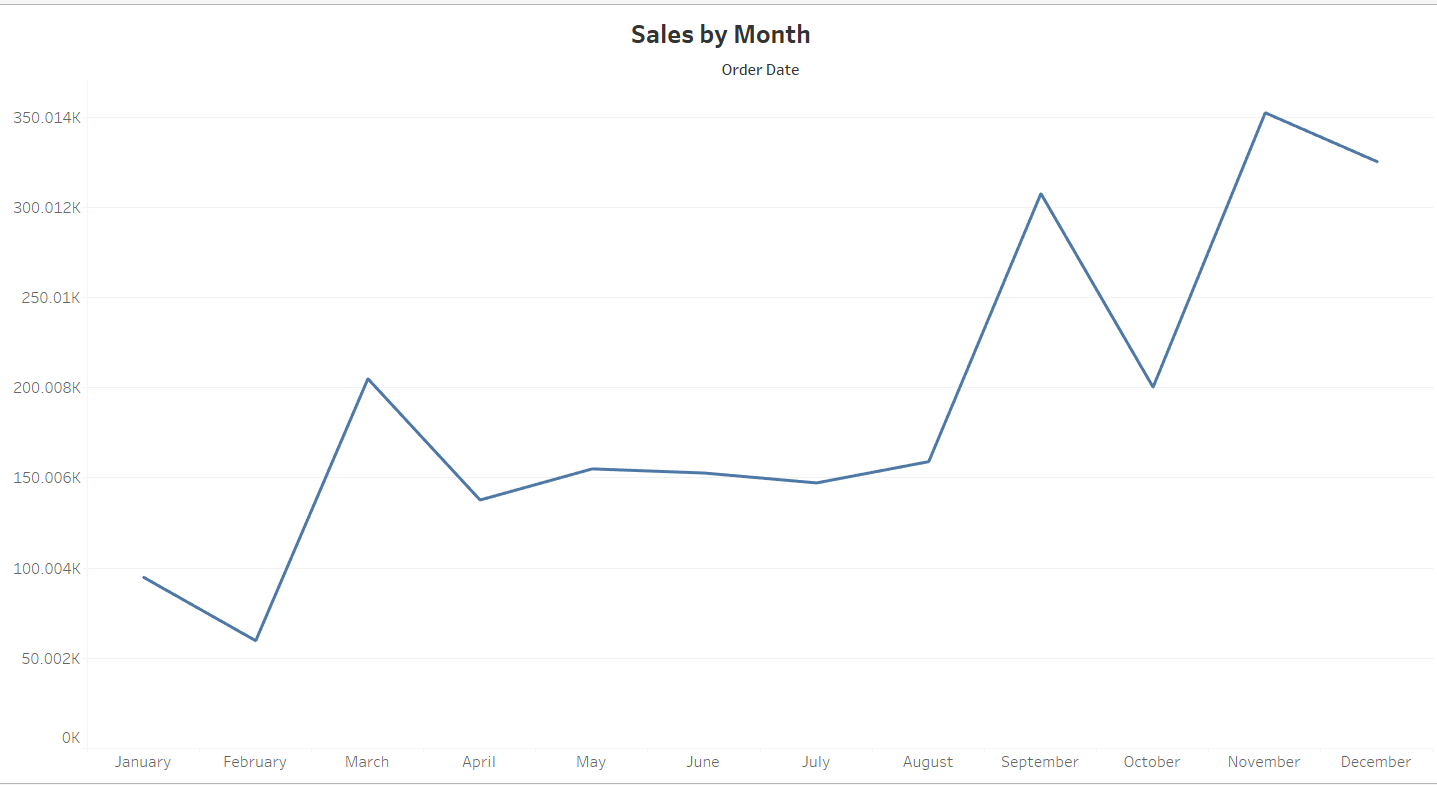
- Create a chart which you want to use as a filter, I am creating sales by month line chart.
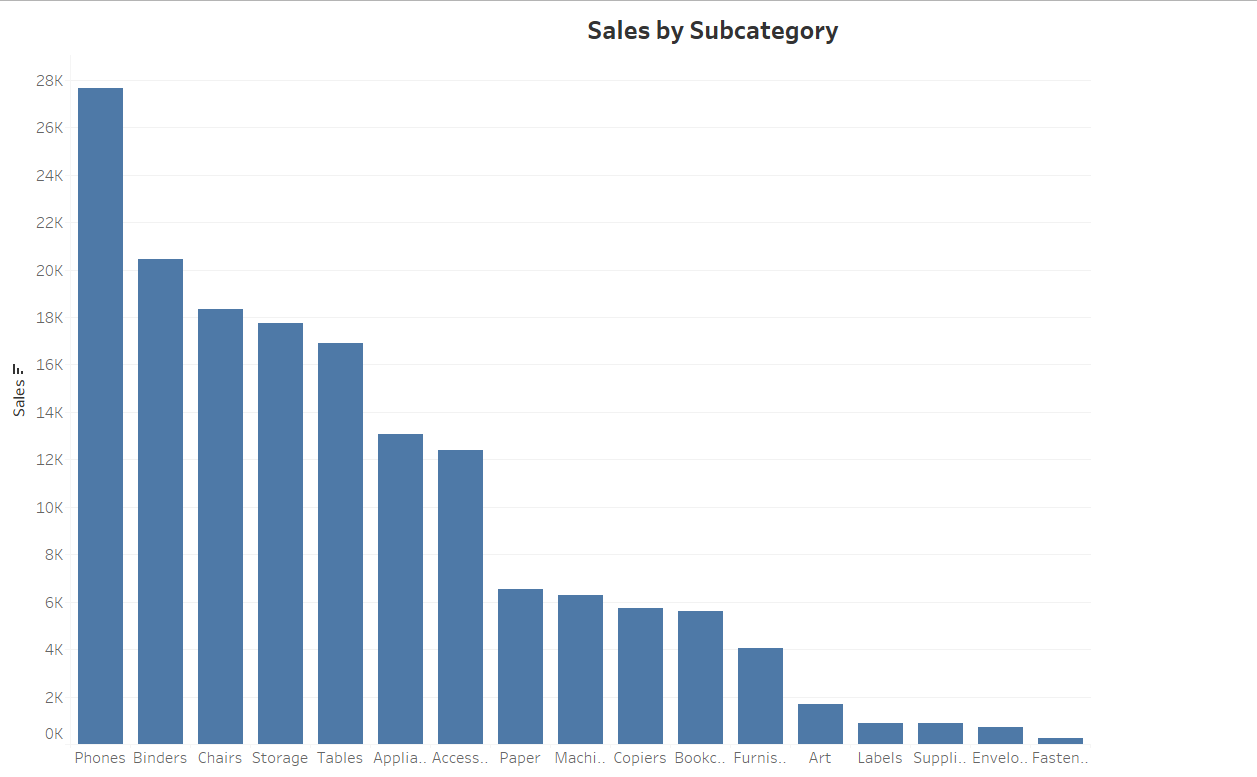
2. Next, you need to create a chart which data value gets filtered based on our selection from first chart. Let’s create a sales by subcategory.
3. Bring these charts in vertical container of dashboard. Now we need to set action for this dashboard.
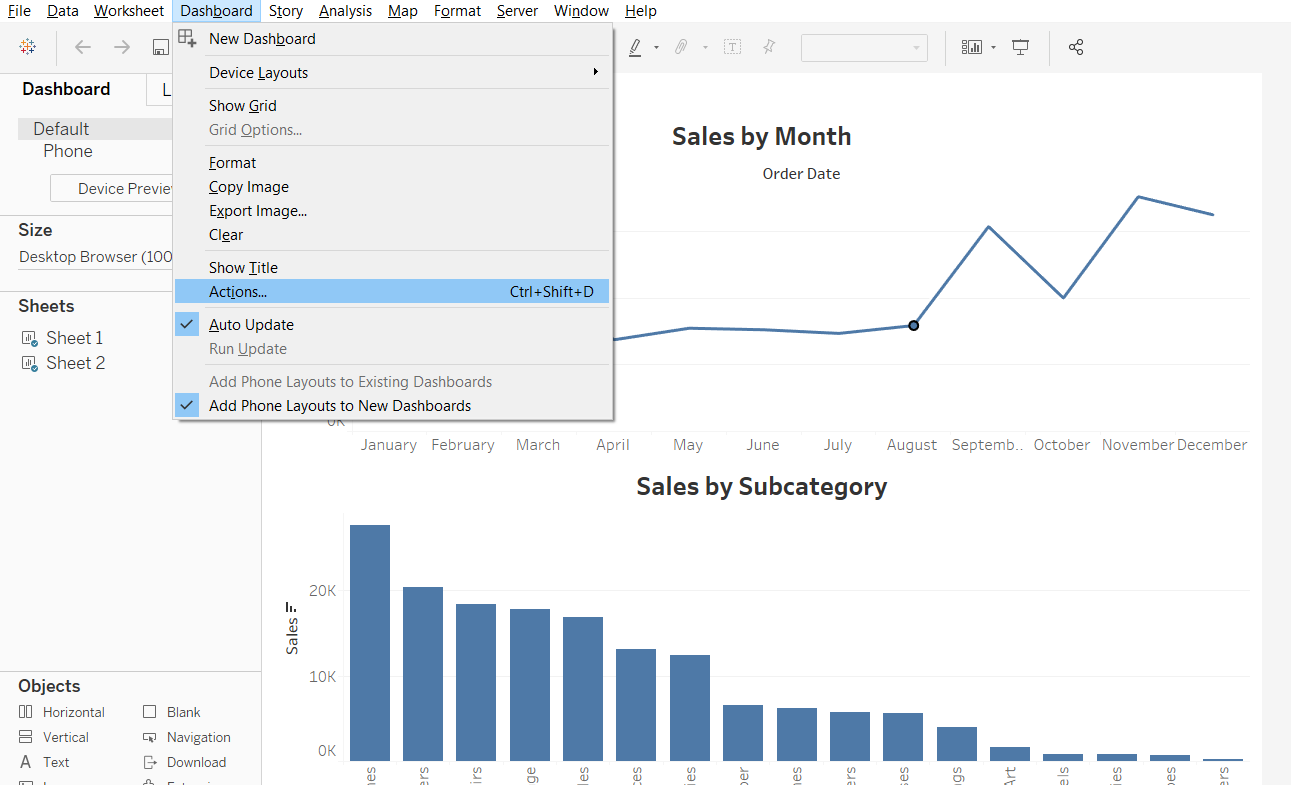
4. From Actions window select Add Action like image below-
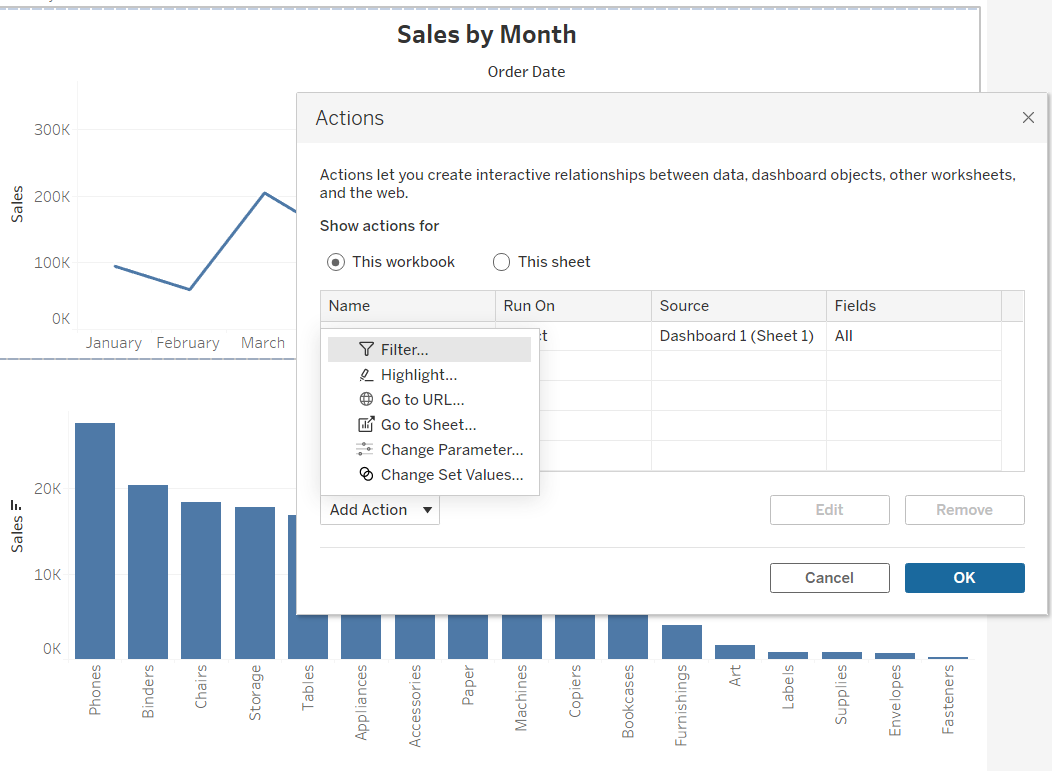
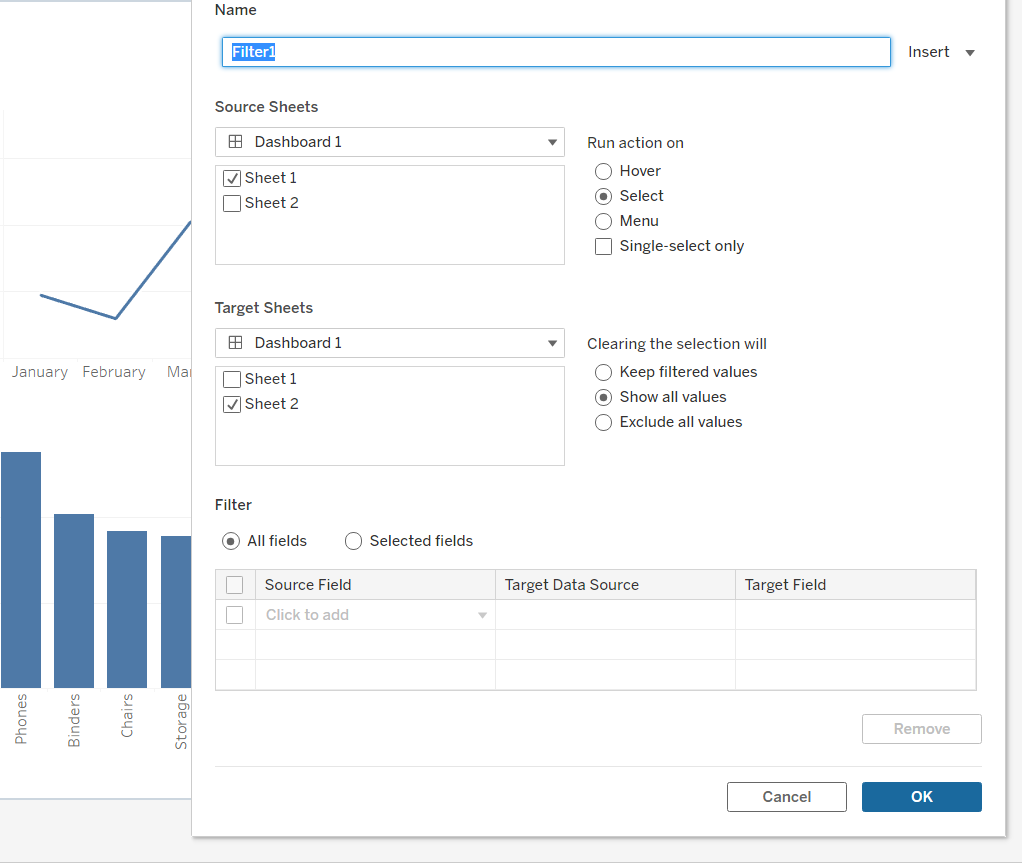
5. Select Filter to create Filter Action and select options as below-
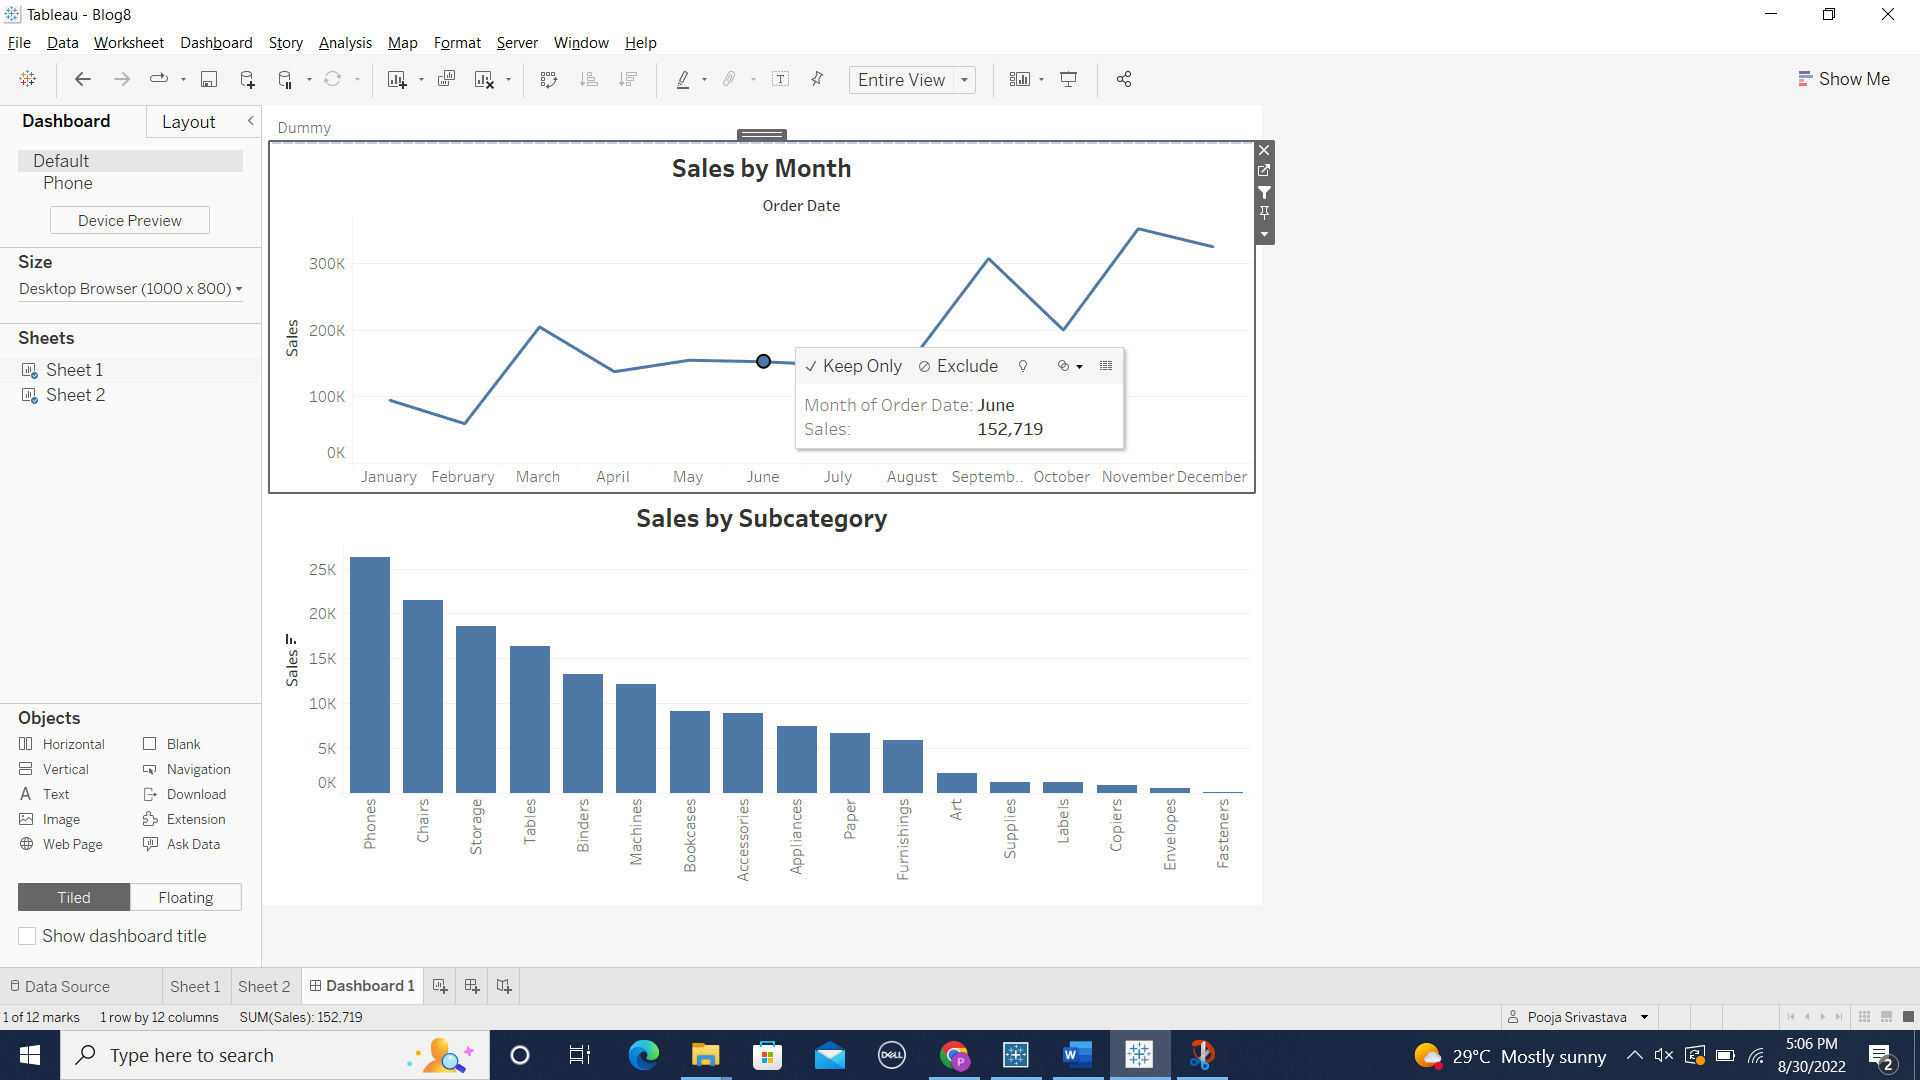
Now, Filter Action is all set up. If you click on line chart, your bar chart gets filtered based on your selection.
In the below image, we selected June in line chart and bar chart is giving sales by subcategory for June month.
I hope this blog helps you to understand filter action and how to implement in your Dashboard.