


This was our last day of Dashboard week, and today we were given World Cup data ranging from 1936 to 2022. We were given free rein to create any type of dashboard we wanted; however, the caveat was that we only had till 1:30 pm.
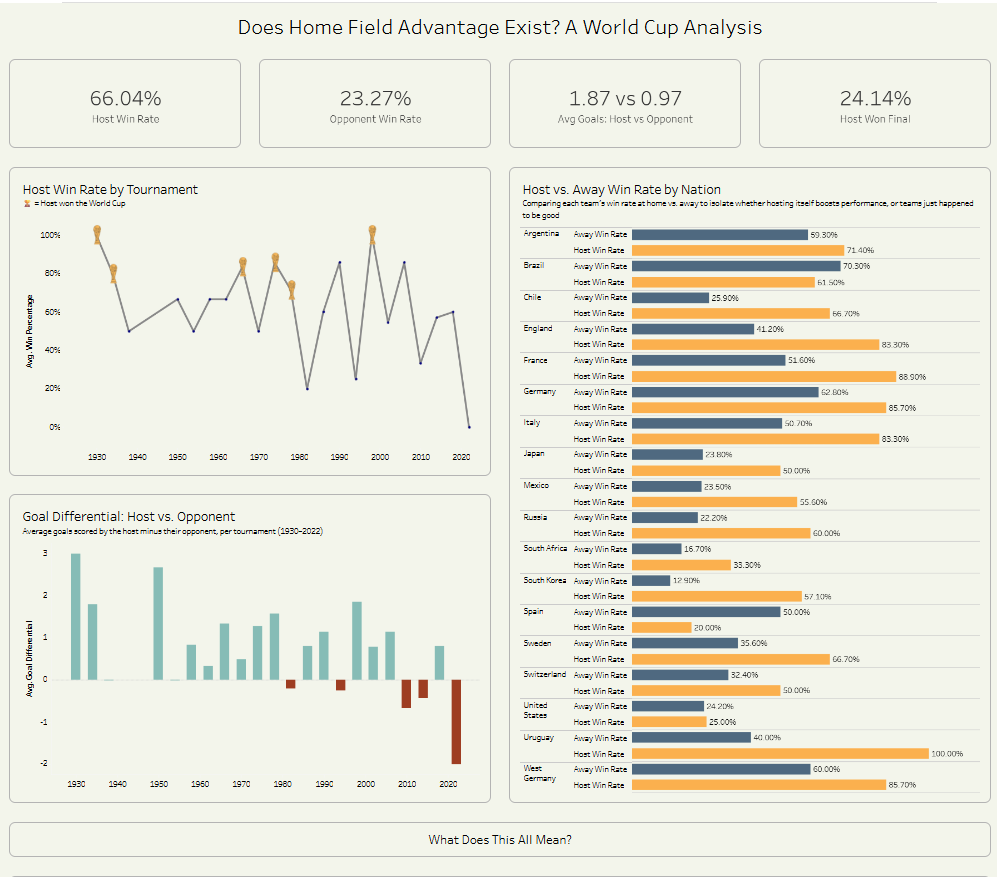
When looking through the dataset, what intrigued me was whether there truly was a home-field advantage for the host country. I did some data exploration and found significant differences in win rates, goals scored, and Tournaments won by the host country compared to its opponents. For my dashboard, I wanted a broad overview of win percentages by host country, goal differential, then a deep dive into if a host team is winning just because they are good, or if hosting the WC actually boosts performance.
One blocker I came across was that in 1974, the Match Country = Germany, but the Winner was West Germany, so I had to recalculate some calculations to take this into account.
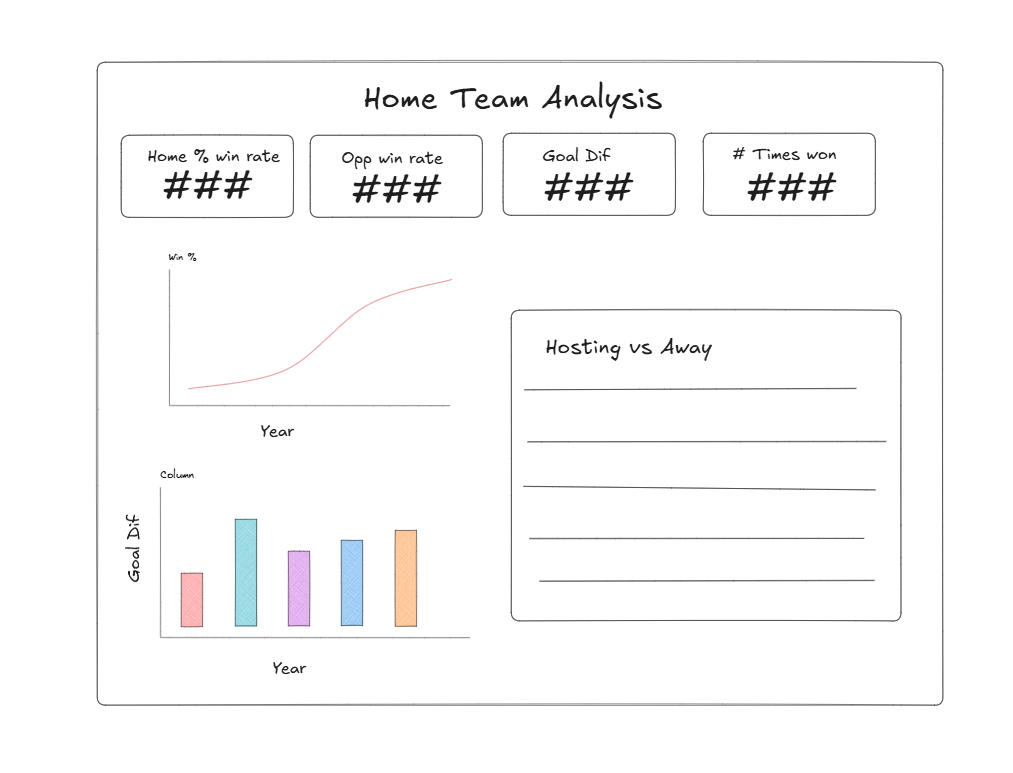
This was my Excalidraw sketch:
And this is my final dashboard:
If you want to view it, you can click here!