


A Z-score is a numerical measurement that describes a value's relationship to the mean of a group of values. Z-score is measured in terms of standard deviations from the mean. If a Z-score is 0, it indicates that the data point's score is identical to the mean score
Simply put, a z-score gives you an idea of how far from the mean a data point is. But more technically it’s a measure of how many standard deviations below or above the population mean a raw score is.
Let's look at an example:
Fred and George are two classmates , Fred gets 65 marks on his Math test, George gets 80 on his English test.
In a comparison who performed better?
We cannot do it by just looking at their results as the variability in their classmates' results can be different i.e. The Math class may have all got lower scores in general, so Fred grade of 65 could be good in comparison. Also the Math test may have been lot harder.
We have the following information about the Exam's:
- Maths marks follow a Normal distribution with mean 60 and standard deviation 4
- English marks follow a Normal distribution with mean 79 and SD 2
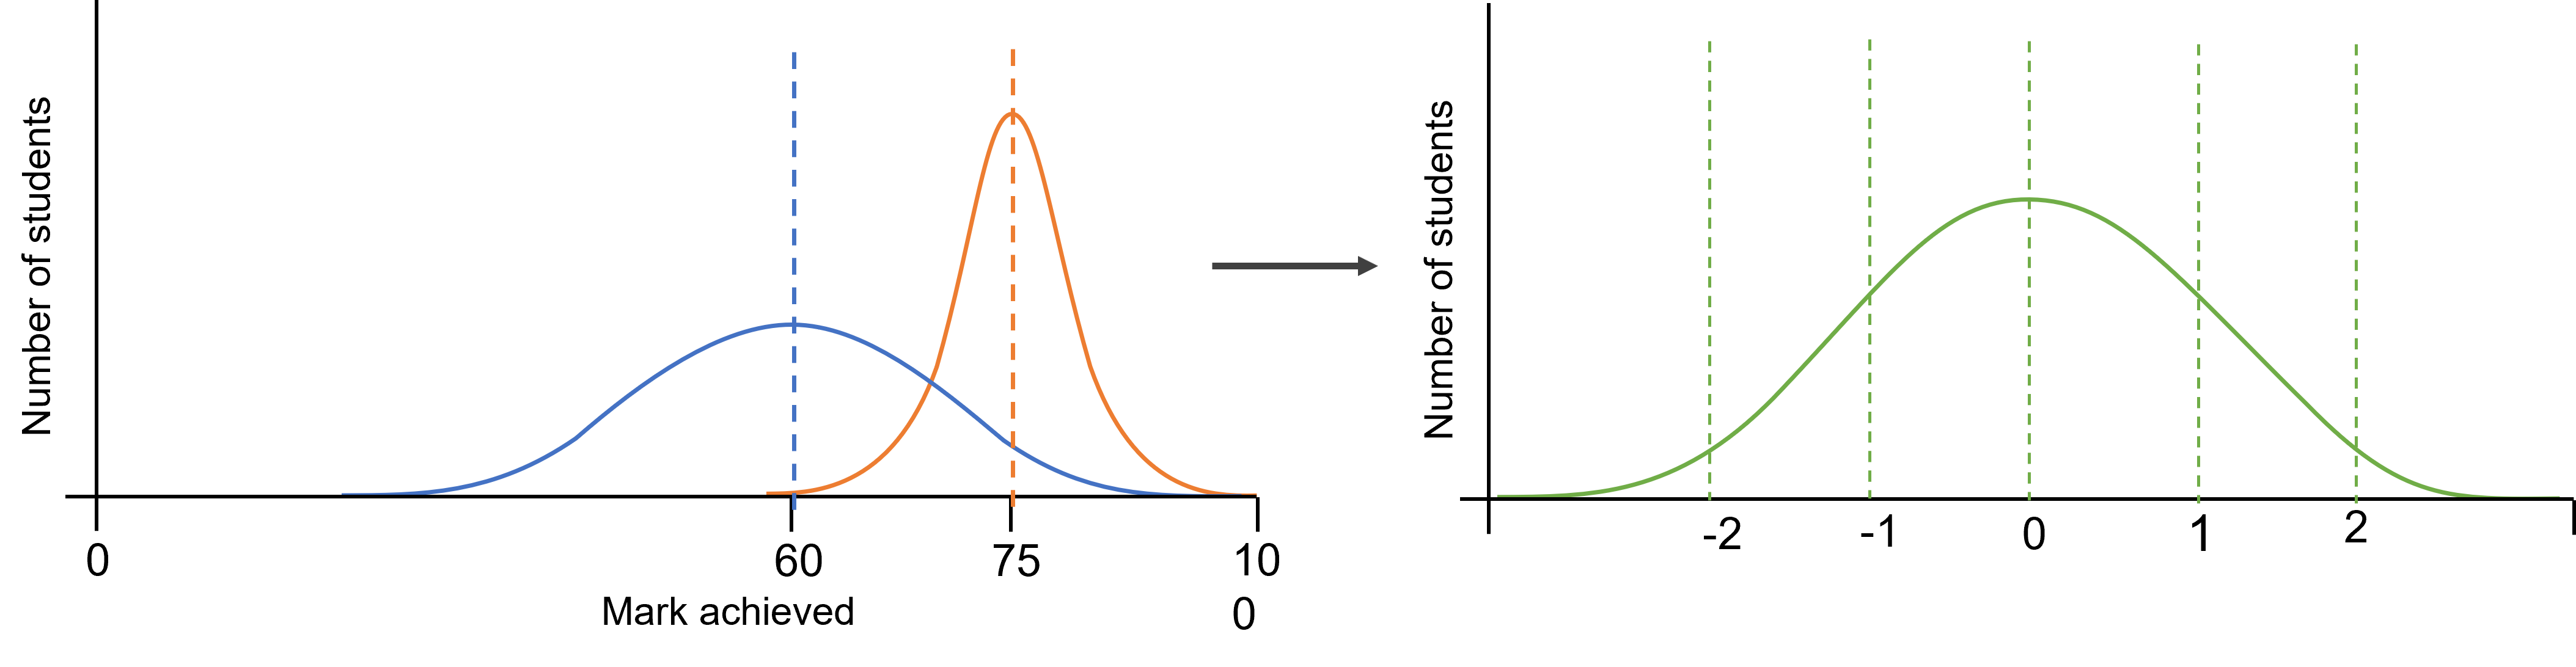
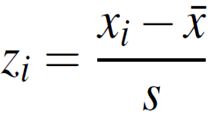
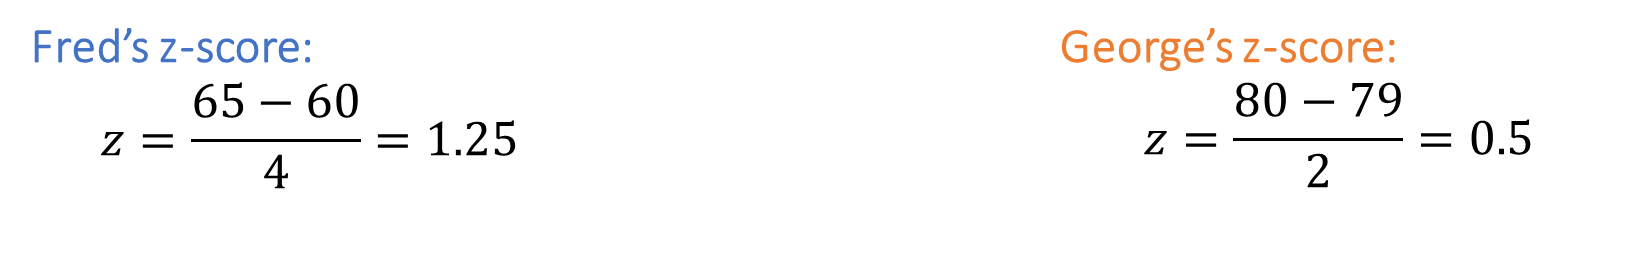
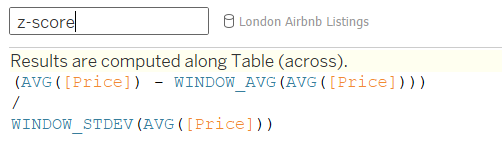
Tableau Example:
dataset: AirBnb listing in London
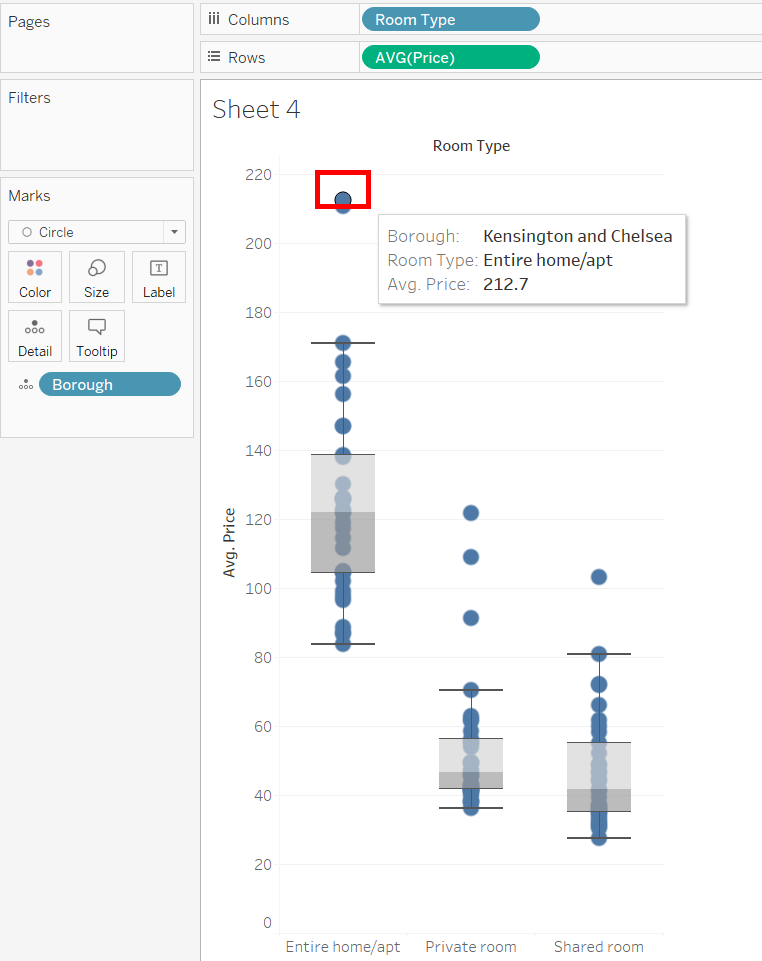
Using a simple boxplot we can get to the conclusion that Kensington is the worst place to rent.
However...
...using a fairly easy calculation the reality is:
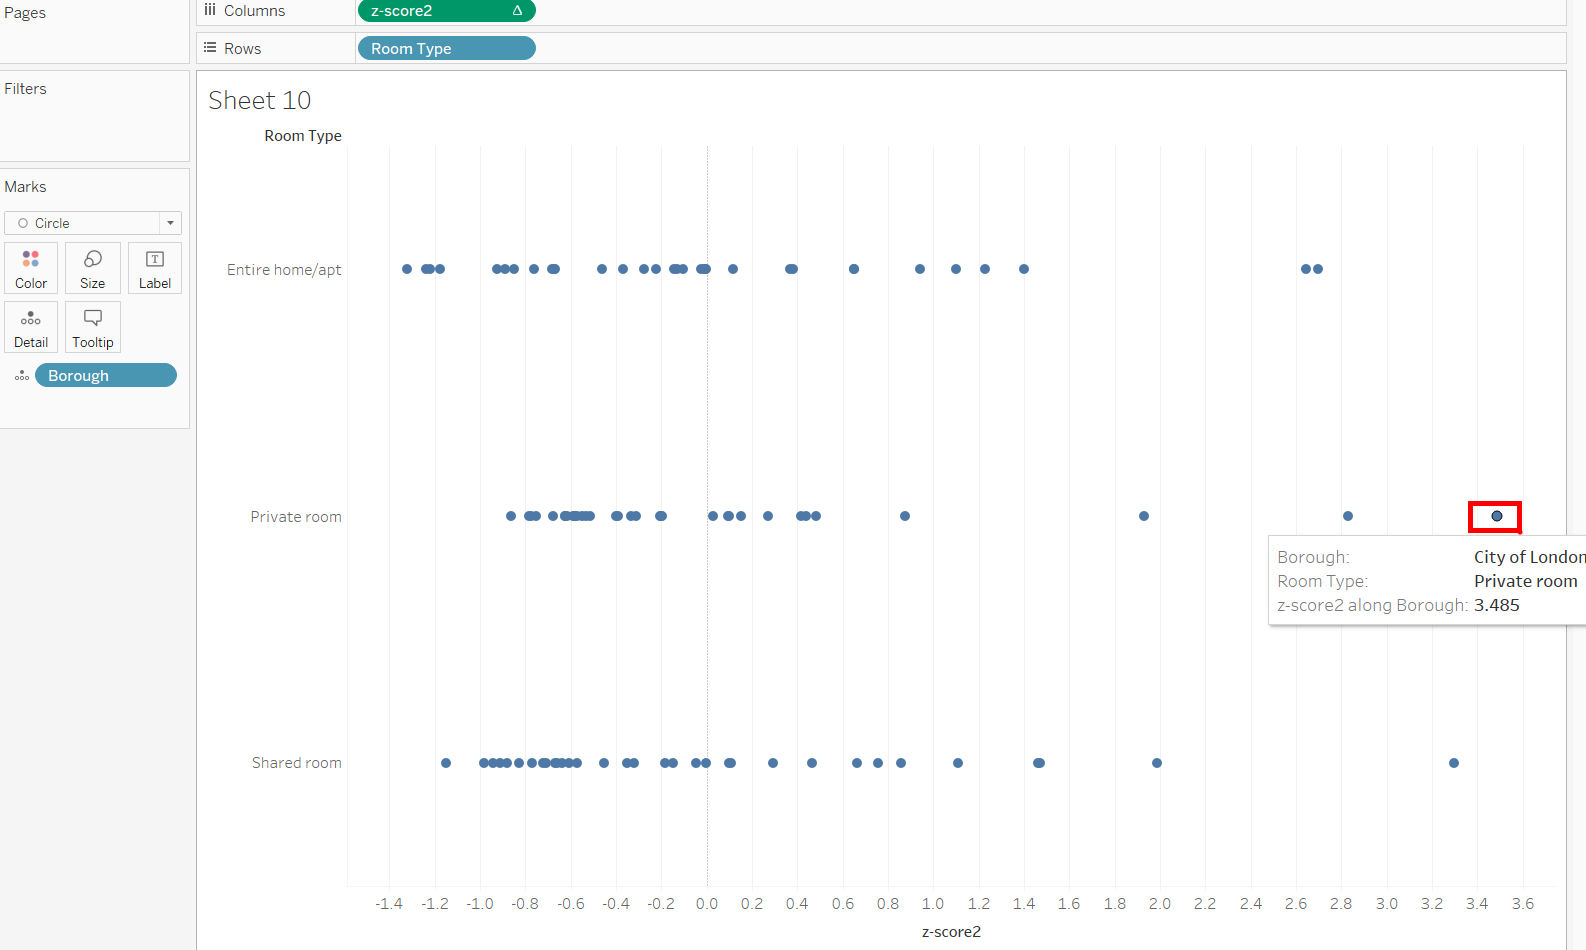
A private room in the City of London is the most expensive option.
Hope you like this little intro into Statistics, if you'd like to read more about z-score Tablerau has a lot more to say: Calculate Z-scores - Tableau
Peter Hajnal | DS33