


In Power BI Desktop, you can find out how each of your report elements, such as visuals and DAX formulas, are performing. By using the Performance Analyzer, you can see and record logs that measure how each of your report elements performs when users interact with them and which aspects of their performance are most (or least) resource intensive.
Performance Analyzer inspects and displays the duration necessary for updating or refreshing all visuals that user interactions initiate. It also presents the information so that you can view, drill down, or export the results. Performance Analyzer can help you identify visuals that affect the performance of your reports and identify the reason for the impact
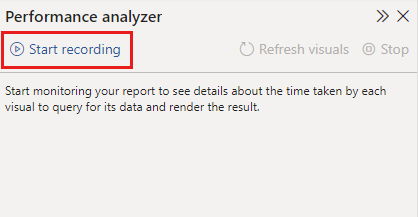
1.Accessing the Performance analyzer


2. Start and Stop Recording
• Start recording before interacting with your report to capture data on the performance of visuals, queries, and DAX calculations. Stop recording when done to view the analysis.
3. Understanding the recorded data
• The tool captures information on visuals, DAX query execution times, model calculations, and other processes, providing detailed breakdowns of time spent in each phase.
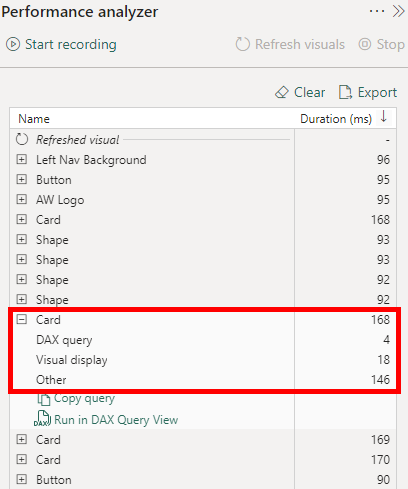
• DAX query - If a DAX query was required, this is the time between the visual sending the query and Analysis Services returning the results.
• Visual display - This is the time required for the visual to draw on the screen, including the time required to retrieve any web images or geocoding.
• Other - This is the time required by the visual for preparing queries, waiting for other visuals to complete, or performing other background processing. Can’t optimize it. If the number is high, it means there’s too many visuals in the report.
• Evaluated parameters (preview) - This is the time spent evaluating the field parameters within a visual. More on Evaluated Parameters
How to improve our DAX query?
- Improve DAX syntax by analyzing queries
- Optimize DAX functions
- Avoid Common Mistakes
1. Improve DAX syntax
• Use Dax Studio to format your code. Formatted code is easier to read and maintain. DAX Studio is a free tool that enables you to transform raw DAX into readable code.
• Copy the queries into DAX Studio for more detailed analysis and troubleshooting.
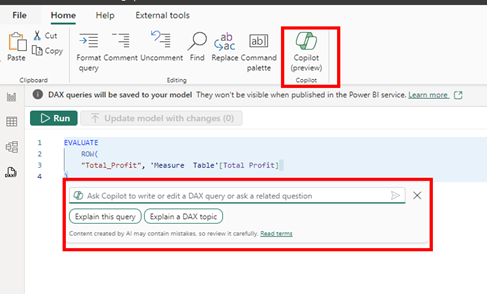
• Dax Query view copilot for premium users
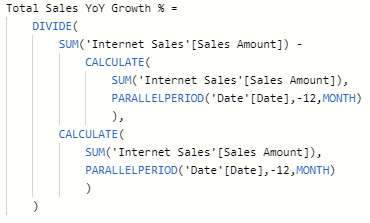
2. Optimize DAX functions
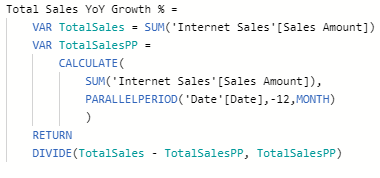
• Use Variables instead of repeating measures
Not-optimized DAX: Ratio = IF([Total Rows] > 10, SUM(Revenue) /[Total Rows], 0)
Optimized DAX: VAR totalRows = [Total Rows]; Ratio = IF(totalRows > 10, SUM(Revenue) / totalRows,0)
Instead of calculating the same expression multiple times, you can store the resulting measure value in a variable. You can use a variable reference wherever required.. Variables can help you avoid repetitive functions.
• Note: Be aware that variables are actually constants
Original measure
Re-written measure using variables
2. Optimize DAX functions
- Use ISBLANK() instead of =Blank() check
Use the built-in function ISBLANK() to check for any blank values instead of using the comparison operator = Blank(). While = Blank() returns ‘True’ value for either blank values or empty strings, IsBlank exclusively checks for blanks.
- Use = 0 instead of checking for ISBLANK() || = 0
The BLANK value in Power BI is associated with the base value of a column’s data type. The BLANK value corresponds to “0” for integers, “(empty string)” for string columns, and “1–1–1900” for date fields.
ISBLANK() || = 0 enacts two checks: first it checks if a column is BLANK, then it checks for zeroes. = 0 performs both checks at once, improving calculation speed.
To check exclusively for zero, use the IN operator.
3. Use COUNTROWS instead of COUNT
In Power BI, you can either use the COUNT function to count column values, or the COUNTROWS function to count table rows. Both functions achieve the same result if the counted column contains no BLANKs.
COUNTROWS is usually the better option for three reasons:
- It's more efficient and will perform better
- It doesn't consider BLANKs
- The formula intention is clearer and self-descriptive
For example: Sales Orders = COUNT(Sales [OrderDate])
versus Sales Orders = COUNTROWS(Sales)
Reference: DAX-CountRows
…. More here
3. Avoid Common Mistakes
- Do not change BLANK values to zeros or other strings
It is common practice to replace blanks with zeros or other strings. However, Power BI automatically filters all rows with blank values. When viewing results from tables with large amounts of data, this limits the result set and improves performance.
If you replace blanks, Power BI does not filter the unwanted rows, negatively affecting performance.
- Stop using IFERROR() and ISERROR()
The IFERROR() and ISERROR() functions were widely used in Excel when applying the FIND() and SEARCH() functions. They were necessary because FIND() and SEARCH() returned errors if the query did not obtain the required result.
The IFERROR() and ISERROR() functions force the Power BI engine to perform a step-by-step execution of each row to check for errors. There is currently no method to directly state which row returned the error.
The FIND() and SEARCH() DAX functions provide an extra parameter that the query can pass. The parameter is returned if the search string is not present. The FIND() and SEARCH() DAX functions check if more than one value is returned. They also ensure nothing is divided by zero.
You can avoid using the FIND() and SEARCH() DAX functions altogether by using situationally appropriate DAX functions such as DIVIDE() and SELECTEDVALUE(). The DIVIDE() and SELECTEDVALUE() functions perform error check internally and return the expected results.
Remember: You can always use DAX expressions in such a way that they never return an error.
…. More here
Useful links
Websites:
•PBI Best Practices
•DAX Best Practices
•Performance Analyzer
•21 Ways to optimize DAX
•Using variables
Videos:
•Understanding Performance Analyzer
•Debugging a slow report
PowerPoint
•From 0 to DAX (132pages)