


With useful feedback from yesterday's presentation, I started this one with more ideas of how my day will look like. Think-Plan-Execute-Think-Eat-Think-Execute.
I also decided to put everything on slides, so I have myself sort of thought process master sheet to go to when it comes to one-day projects.
It looks like this:
- How many museums opened and closed in the UK between 1960–2020?
- Line chart of openings and closings
- Did the museums that closed share any commonalities of location, size, subject matter, or
- Closures in more deprived areas versus non-deprived areas
- Where did the new museums open and was growth concentrated in particular nations or regions?
- Define growth, use map if can
The next bit is project specific, but you get the gist.
- How many museums opened and closed in the UK between 1960–2020?
- Line chart of openings and closings
- Did the museums that closed share any commonalities of location, size, subject matter, or
- Closures in more deprived areas versus non-deprived areas
- Where did the new museums open and was growth concentrated in particular nations or regions?
- Define growth, use map if can
The next things I get to do is the jump into data cleaning, today I chose Prep as it was a clean data set, all I had to do is rename some fields, and split some columns.
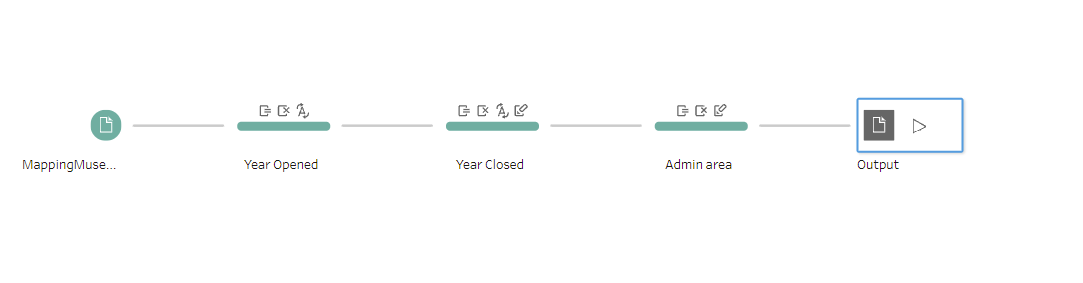
The focus is not on the complexity, more like to have a clear vision through the entire day, and to not lose focus.
Peter Hajnal DS | 33