


Week 6 and we are learning about dashboards. One good idea is to always draw your ideas, drawing is great. Helps you clarify what and how do you want to show data on your dash. It also makes dashboarding a whole lot quicker.
So, for our task we scoped Tableau Public for a good looking viz and then jumped into a new dashboard and recreated it with containers. Since, I'm not the most familiar with that (all I ever used before was floating containers-eeek-) I spent a fair amount of time to find an easy-enough viz. I also realized that drawing will help a lot. So here it is. Was a lot quicker than I thought I will be. Color-coded the different type of containers for clarity and then just re-created it in Tableau.
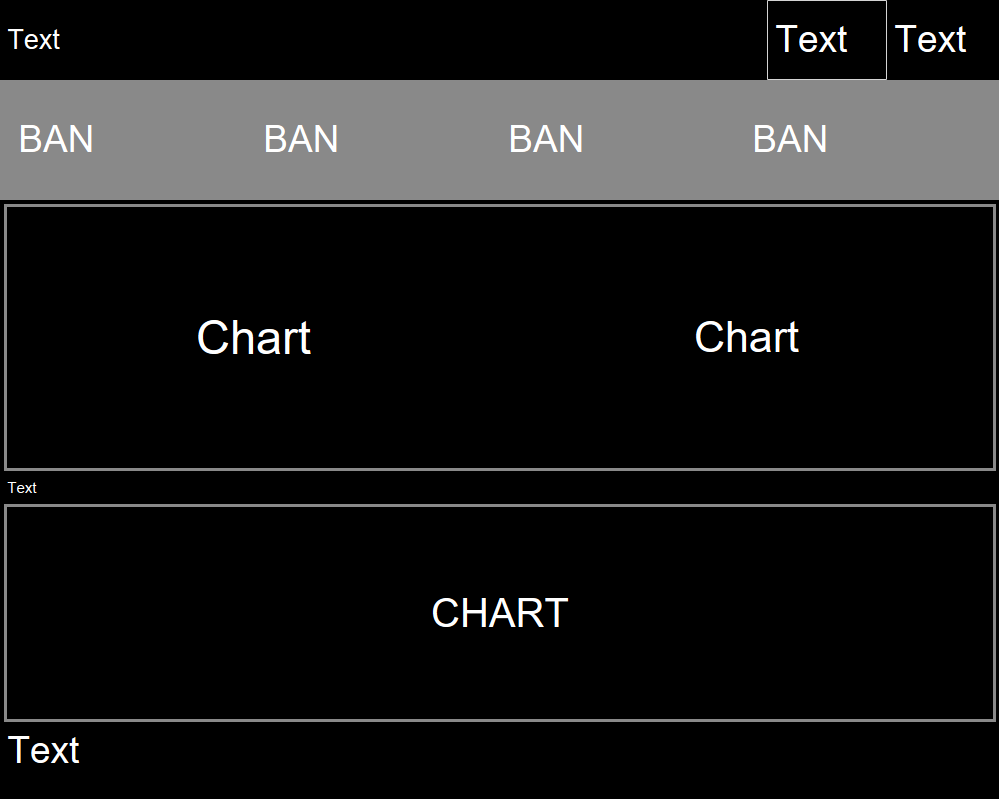
Drawing:

Tableau redo:
The main take-away: Don't think too much, just start acting on the problem, things will fall in place.
Peter Hajnal DS| 33