


Another blog, another Tableau Data Analyst Exam practice question for us to sink our teeth into.

This question is a bit of a mouthful, and slightly more multi faceted than some of its predecessors.
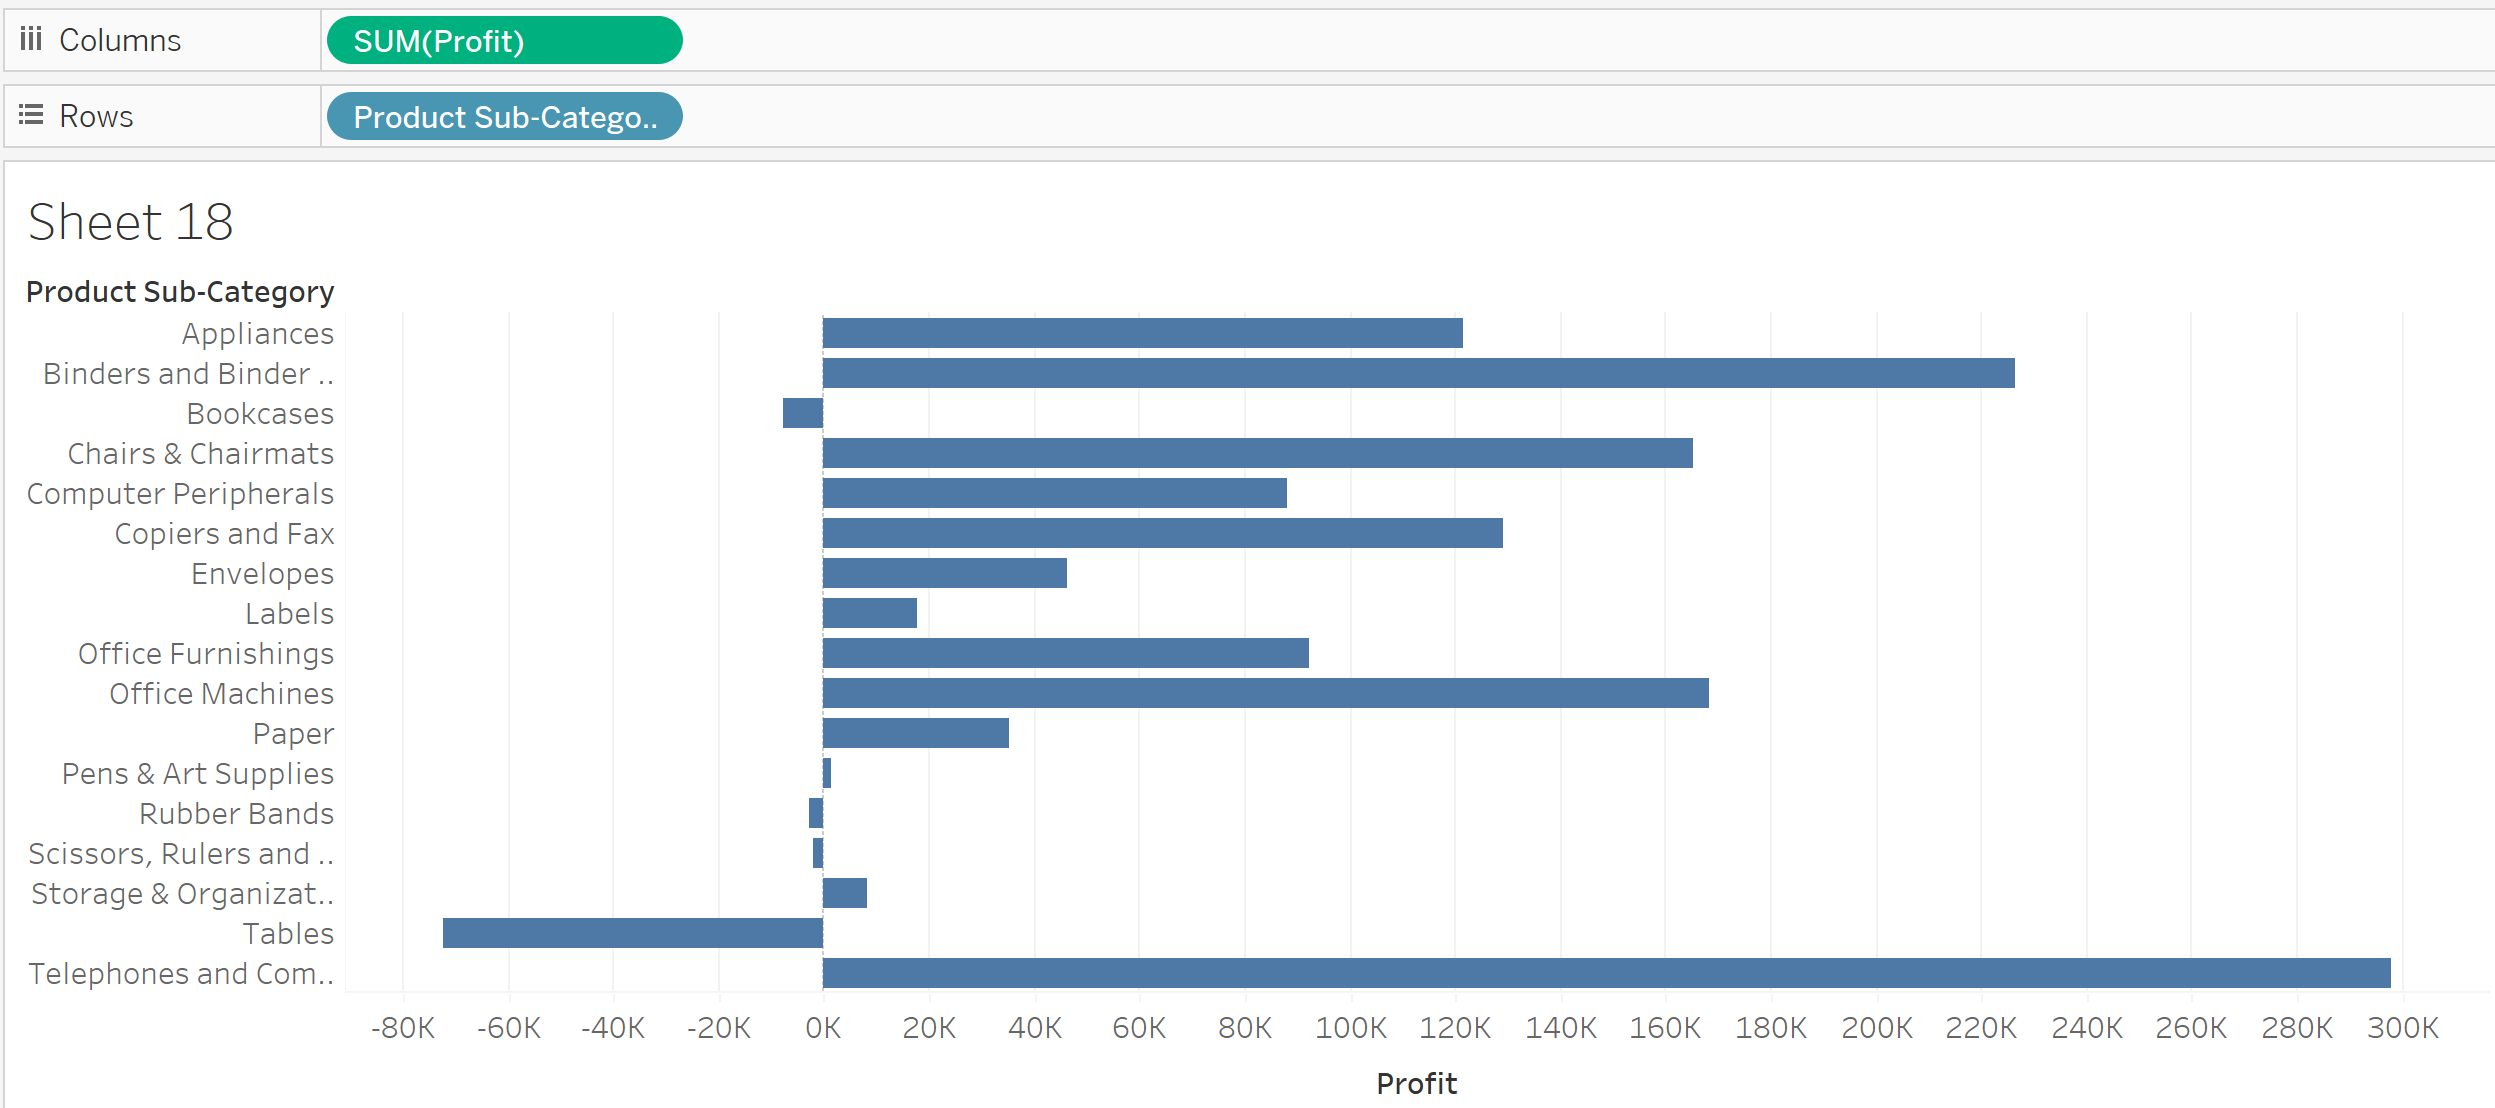
The first thing I have done is sort out the fields we already have, and require, in order to make our bullet chart. I placed Sub Category onto Rows and our SUM(Profit) on Columns.
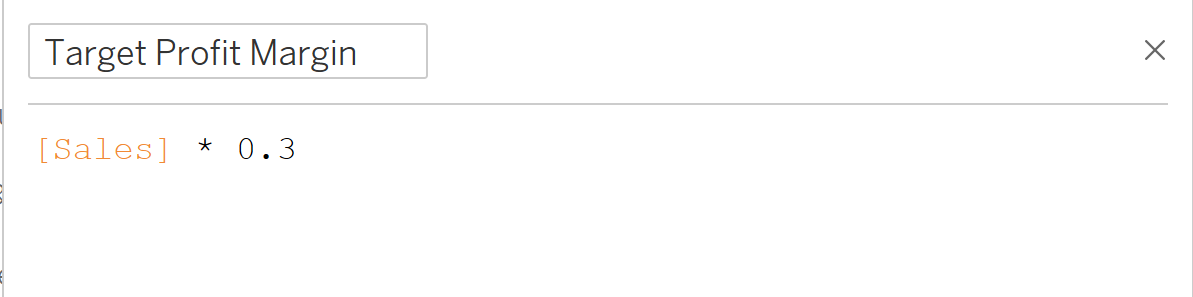
Next, we must create our 'Target Profit Margin' field. The question tells us that our Target Profit Margin should be 30% of Sales, it can therefore be made relatively simply using a Calculated Field, as shown below.
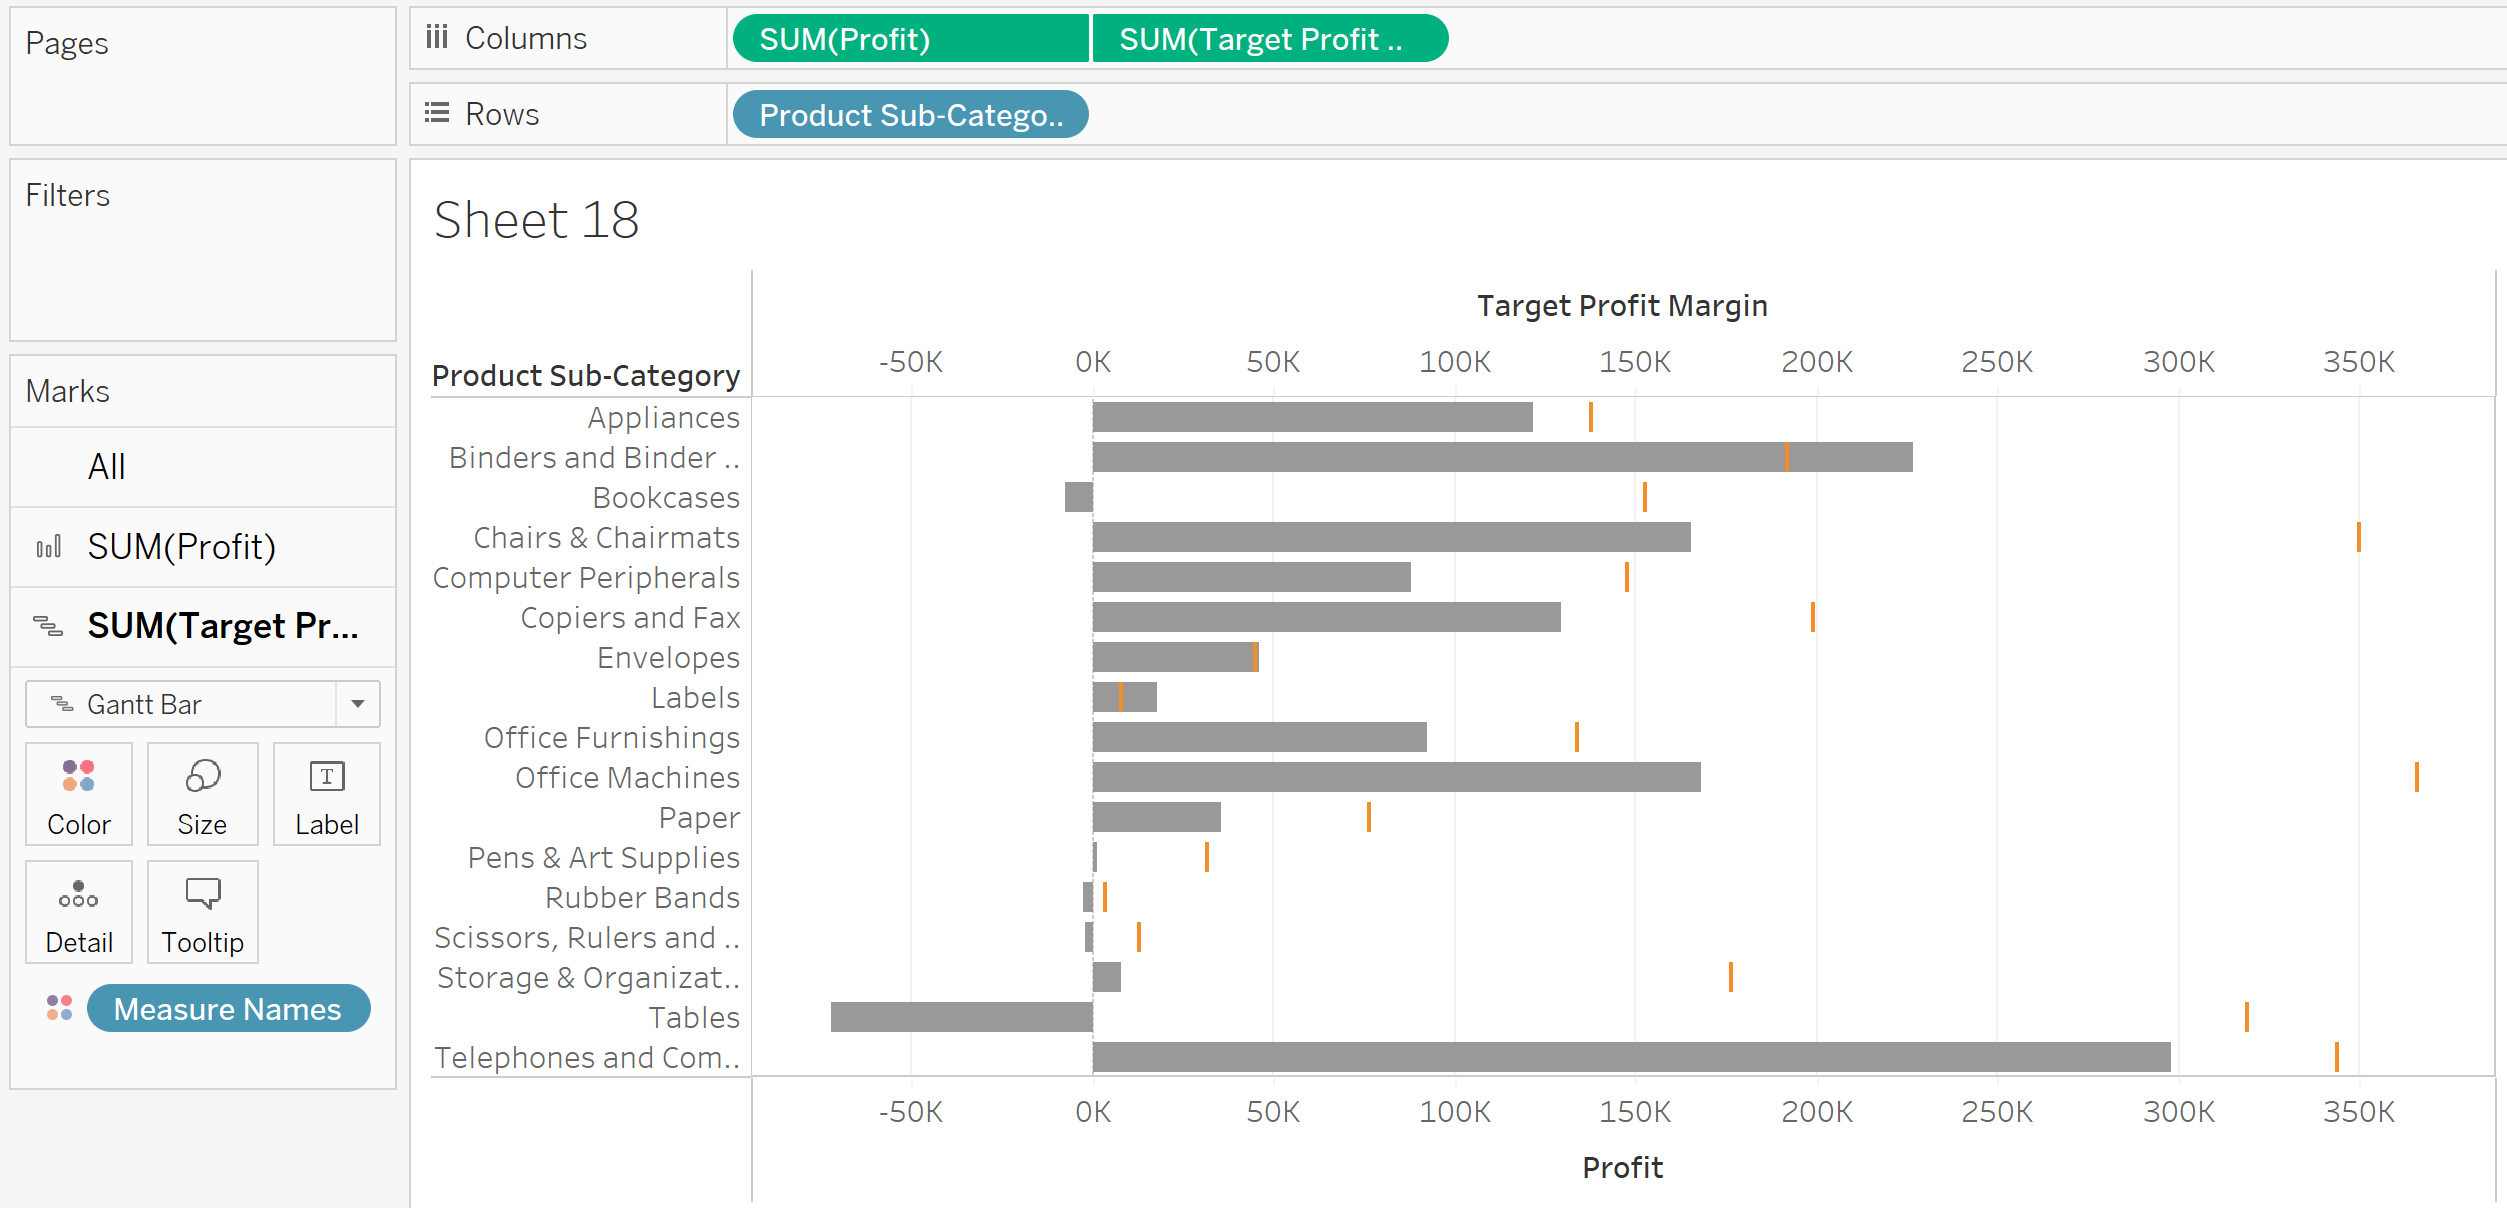
Now that we have our Target Profit Margin, we can place in next to Profit in the Columns, dual axis and synchronize our graph. To create our Bullet Chart I have changed the Mark type for Profit to be a Bar, and for Profit Margin, a Gantt Bar. This leaves us with the following graph.
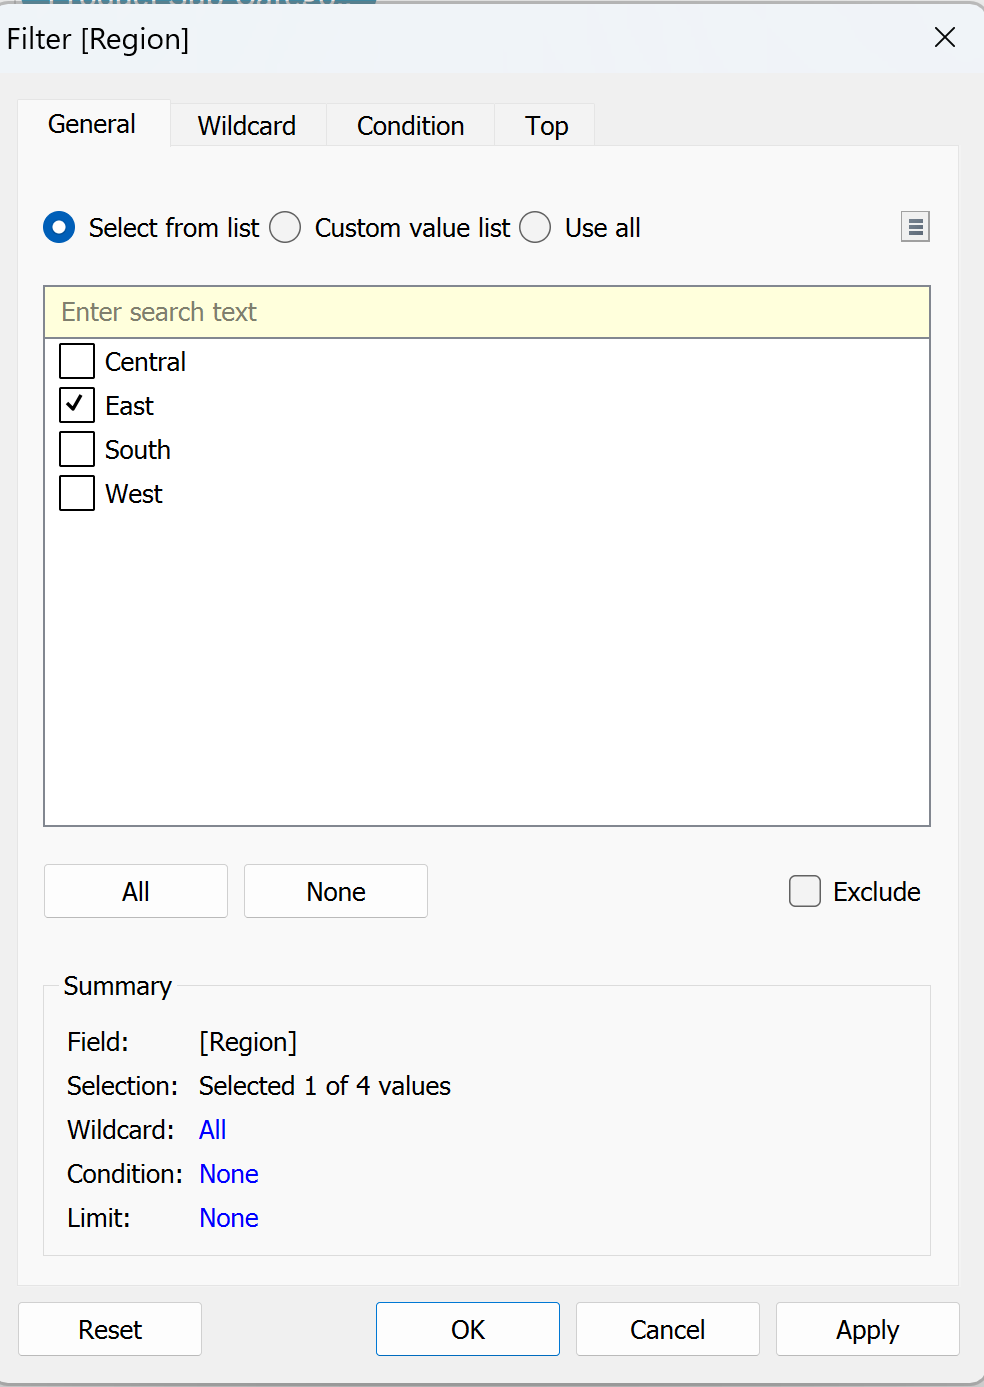
We aren't quite done there yet, however. The question also specifies that we want to see the Sub Category's where Profit is above Target Profit ONLY for the EAST region. We can therefore add Region to the filters, and select East.
This leaves our graph looking like this:
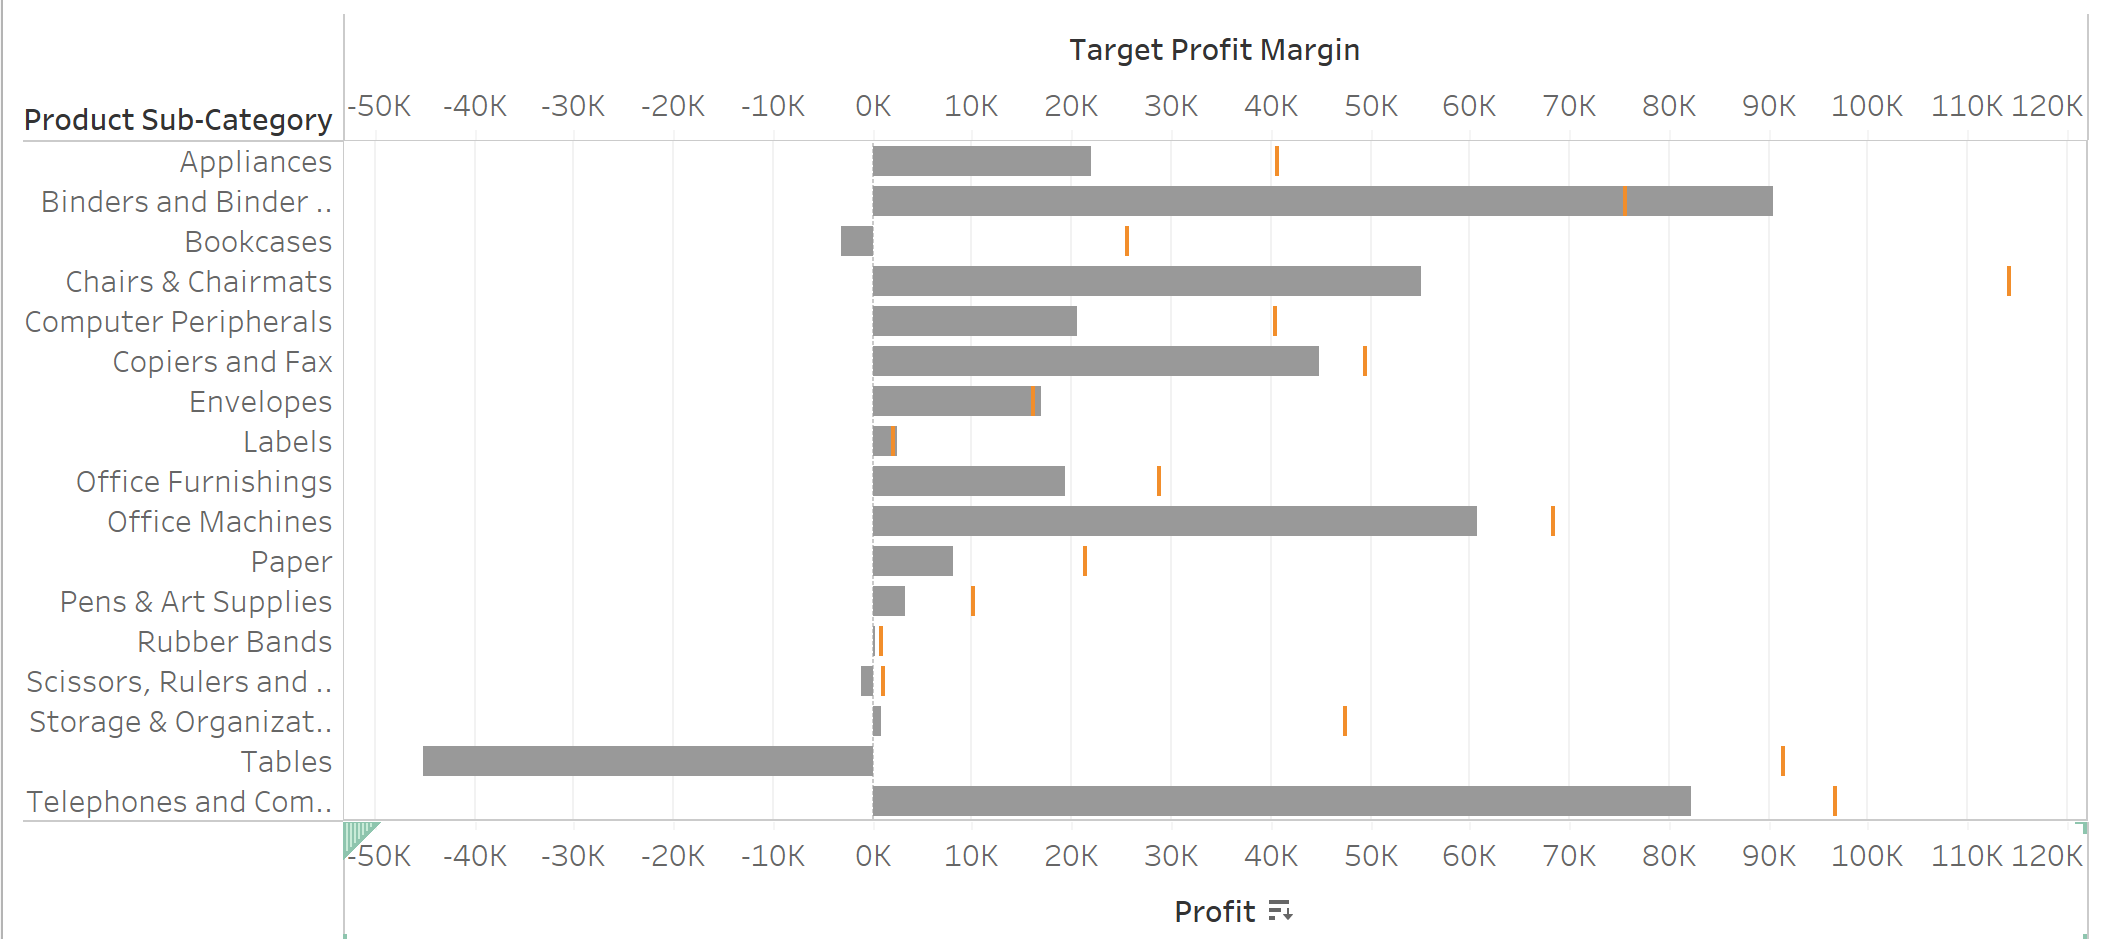
We must note that the questions is asking for 2 Product Sub Categories, and we must select 2 in order to answer the question correctly.
Looking at our graph, and the options in the multiple choice question, we can see that Binders & Binder Accessories + Envelopes are our correct answers.
This question provides a mix of technical skills alongside a bit of wordiness in the question. It's well worth taking ample time to read the question fully and plan your approach.
