


After a 1 day hiatus away from Dashboard Week due to illness, we are back again (not quite at 100%) and ready to go.
Jenny has prepared a corker for our final 2 days of Dashboard Week, we will be participating in a challenge set by Tableau! The challenge is called Data + Movies, and involves telling stories using IMDB data.
Tableau have provided a sample dataset and dashboard to provide some inspiration. However, this was where the trouble began. Sadly, the given dashboard was failing to download for me, and thus I had an extensive period where I was unable to access the data. However, it gave me good time to think and plot some of my ideas.
The initial idea I had was to explore something to do with the financial performance of IMDB's films. I thought it would be interesting to see how the rankings of films correlates to he financial success of these films at Box Office. So I decided to focus on the top 500 movies with the Most Reviews on IMDB, to see how they stacked up. The results, as you will see, are well interesting. After sharing my idea on Convo, and getting some thoughts from Jenny and Carl, my sketched ideas were looking like this.
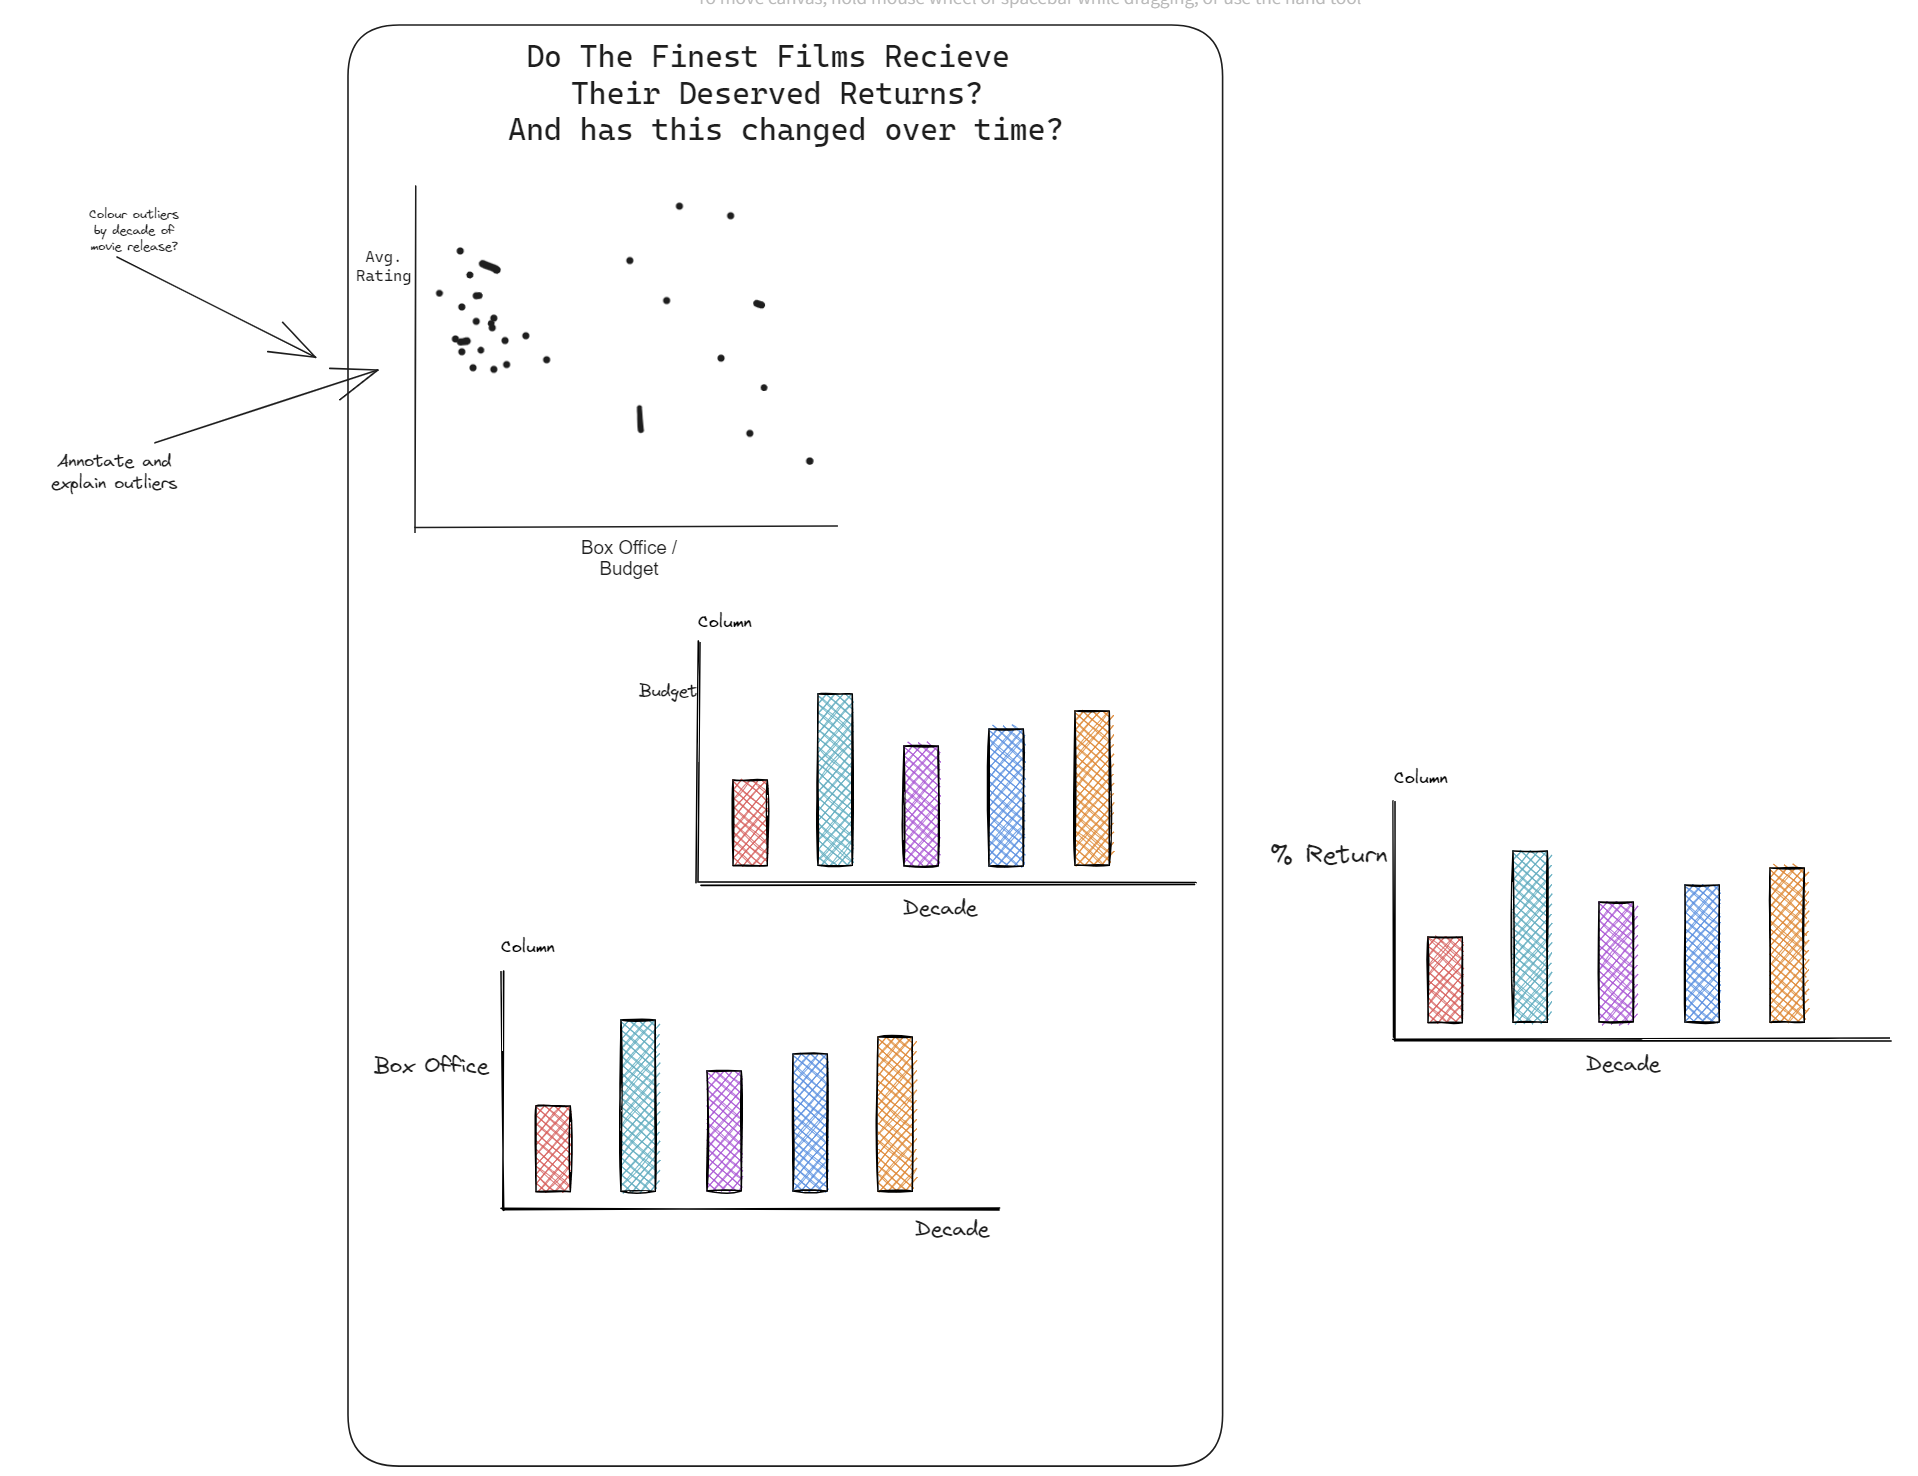
Very unpolished, and undecided. I was clearly lacking a bit of inspiration this week.
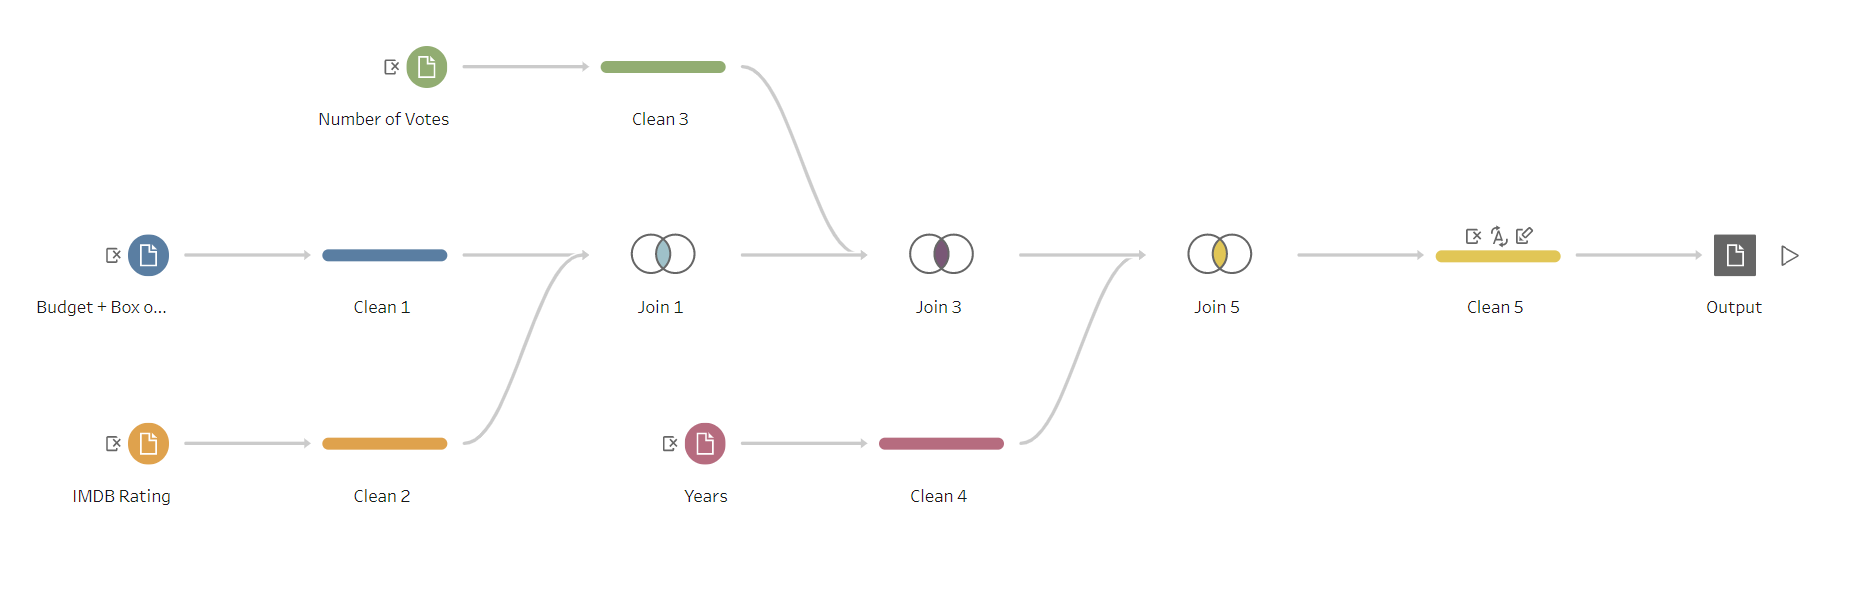
Once the example dashboard was downloaded, I used it to extract solely the data I needed. I did this by creating simple bar charts of the data I needed, and then extracting the data from those existing worksheets. The data on the Budget of each film, and Box Office performance, was sadly not quite as easily accessible. For these figures I went to Wikipedia, and with the help of my assistant Chat GPT, had the figures in a presentable manner I could add to the data I had extracted. As I now had all the data, it was time to join it together in Tableau Prep into one clean data source. This was fairly simple as I could simply join each table together with Join Condition, 'Title = Title'.
I didn't get much noteworthy finished in terms of Dashboarding. Some of the charts were relatively simple to make, but in terms of piecing it all together, that is tomorrow's job. Fingers Crossed!